THE100
MOST
OVERPAID
CEOs
Are Fund Managers
Asleep at the Wheel?
CEO pay continues to increase. Institutional Shareholder Services (ISS) ¹ reported that the median CEO pay increase last year was 6 percent among the S&P 500 companies. Given the methodology used to calculate CEO pay, this may be under reported. Most reports on CEO pay – including ours – use total disclosed compensation as reported by companies under SEC requirements. This includes an estimated “grant date value” of equity and stock option awards. In the recent sustained bull market, it has become apparent that this figure vastly understates the amount of money that executives receive. A report by the Economic Policy Institute found that value of CEO compensation has grown 52.6 percent in the recovery since 2009 using an “options- exercised” measure compared to just 29.4 percent using the “options-granted” measure.²
When company performance is considered, the most overpaid CEOs are disproportionately overpaid. Regression analysis showed that 15 of the most overpaid CEOs on our list each had compensation that was at least $20 million higher than if their pay had been properly aligned with performance. Of these CEOs, one received compensation that was $200 million above what the performance of the company justified, another one was $100 million above what it should have been based on TSR, and two others more than $50 million higher.
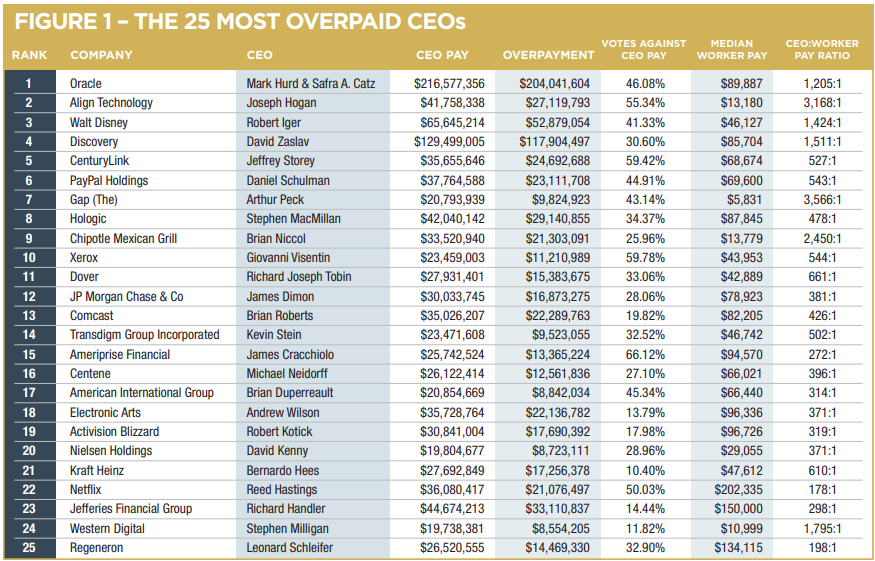
The list of the 100 Most Overpaid CEOs contains many repeat offenders. Figure 1 identifies the companies with the 25 most overpaid CEOs, and his (yes, they are all men!) pay as reported in the company proxy statement, as well as the pay of his median employee and the ratio of the CEO’s pay to that of the employee. In this list, the Walt Disney company appears for the third year in a row, and American International, Ameriprise, Centene, Jefferies Financial, and Netflix appear for the second year in a row.
Shareholder votes against CEO pay packages can encourage companies to make significant reforms. An analysis by Equilar found that companies with failed pay votes in 2018 implemented a number of changes, the three most common of which were: increasing the proportion of long-term incentive plan grants strictly tied to performance, reducing overall pay, and changing metrics or weighting among other changes.³ Another analysis by Ran Bi of Equilar, covered by the Harvard Law School Forum on Corporate Governance, found that “average CEO total compensation at companies that failed Say on Pay decreased significantly from 2011 to 2017, a total of 44.9% over that time frame.”⁴ Shareholder pressure at Disney led to several changes to Robert Iger’s employment agreement, including some just a few days before the annual meeting. (See page 20).
The level of shareholder opposition to excessive CEO pay continues to grow. A Financial Times article defines opposition from 20 percent of the shareholders as a marker to define a shareholder revolt. The article found that last year, among the S&P 500 companies, 61 had reached that level of opposition, a 33 percent increase from the 46 companies that had that level of opposition in 2014.⁵ As reported in the CLS Blue Sky Blog, Institutional Shareholder Services (ISS) calculated that the share of Russell 3000 companies with meetings from January to May receiving shareholder support of less than 80 percent for their CEO pay packages reached 13.5 percent in 2019, a stark 44 percent increase from the 9.4 percent of in 2017.⁶
Many financial fund managers continue to improve their analysis and vote against more CEO pay packages each year. There were 30 financial fund managers (with combined AUM of over $3.6 trillion) that increased the number of CEO pay packages they voted against by more than 10 percent between 2018 and 2019. In this report we look at we look at several of them, specifically, UBS Asset Management, Sarasin, and CalPERS.
The largest fund managers – particularly BlackRock – are total outliers in their voting on the issue of CEO pay. They opt to vote against only a very few of the CEO pay packages, and their votes are hard to understand. In 2018, BlackRock voted against more pay packages of CEOs who were paid less than $5 million than they did for CEOs paid over $20 million. Since many pension funds use Blackrock as one of their financial managers, they may not be fully aware of what Blackrock is doing (and not doing) on their behalf.
| RANK | COMPANY | CEO | CEO PAY | OVERPAYMENT | VOTES AGAINST CEO PAY | MEDIAN WORKER PAY | CEO:WORKER PAY RATIO |
|---|---|---|---|---|---|---|---|
| 1 | Oracle | Mark Hurd & Safra A. Catz | $216,577,356 | $204,041,604 | 46.08% | $89,887 | 1,205:1 |
| 2 | Align Technology | Joseph Hogan | $41,758,338 | $27,119,793 | 55.34% | $13,180 | 3,168:1 |
| 3 | Walt Disney | Robert Iger | $65,645,214 | $52,879,054 | 41.33% | $46,127 | 1,424:1 |
| 4 | Discovery | David Zaslav | $129,499,005 | $117,904,497 | 30.60% | $85,704 | 1,511:1 |
| 5 | CenturyLink | Jeffrey Storey | $35,655,646 | $24,692,688 | 59.42% | $68,674 | 527:1 |
| 6 | PayPal Holdings | Daniel Schulman | $37,764,588 | $23,111,708 | 44.91% | $69,600 | 543:1 |
| 7 | Gap (The) | Arthur Peck | $20,793,939 | $9,824,923 | 43.14% | $5,831 | 3,566:1 |
| 8 | Hologic | Stephen MacMillan | $42,040,142 | $29,140,855 | 34.37% | $87,845 | 478:1 |
| 9 | Chipotle Mexican Grill | Brian Niccol | $33,520,940 | $21,303,091 | 25.96% | $13,779 | 2,450:1 |
| 10 | Xerox | Giovanni Visentin | $23,459,003 | $11,210,989 | 59.78% | $43,953 | 544:1 |
| 11 | Dover | Richard Joseph Tobin | $27,931,401 | $15,383,675 | 33.06% | $42,889 | 661:1 |
| 12 | JP Morgan Chase & Co | James Dimon | $30,033,745 | $16,873,275 | 28.06% | $78,923 | 381:1 |
| 13 | Comcast | Brian Roberts | $35,026,207 | $22,289,763 | 19.82% | $82,205 | 426:1 |
| 14 | Transdigm Group Incorporated | Kevin Stein | $23,471,608 | $9,523,055 | 32.52% | $46,742 | 502:1 |
| 15 | Ameriprise Financial | James Cracchiolo | $25,742,524 | $13,365,224 | 66.12% | $94,570 | 272:1 |
| 16 | Centene | Michael Neidorff | $26,122,414 | $12,561,836 | 27.10% | $66,021 | 396:1 |
| 17 | American International Group | Brian Duperreault | $20,854,669 | $8,842,034 | 45.34% | $66,440 | 314:1 |
| 18 | Electronic Arts | Andrew Wilson | $35,728,764 | $22,136,782 | 13.79% | $96,336 | 371:1 |
| 19 | Activision Blizzard | Robert Kotick | $30,841,004 | $17,690,392 | 17.98% | $96,726 | 319:1 |
| 20 | Nielsen Holdings | David Kenny | $19,804,677 | $8,723,111 | 28.96% | $29,055 | 371:1 |
| 21 | Kraft Heinz | Bernardo Hees | $27,692,849 | $17,256,378 | 10.40% | $47,612 | 610:1 |
| 22 | Netflix | Reed Hastings | $36,080,417 | $21,076,497 | 50.03% | $202,335 | 178:1 |
| 23 | Jefferies Financial Group | Richard Handler | $44,674,213 | $33,110,837 | 14.44% | $150,000 | 298:1 |
| 24 | Western Digital | Stephen Milligan | $19,738,381 | $8,554,205 | 11.82% | $10,999 | 1,795:1 |
| 25 | Regeneron | Leonard Schleifer | $26,520,555 | $14,469,330 | 32.90% | $134,115 | 198:1 |
This report has a strong focus on financial manager voting, which is disclosed on an annual basis. The pay packages evaluated were those where votes were cast prior to June 30, 2019. In some cases, CEOs presented here and in Appendix A no longer hold that position.
The public recognition that CEOs are overpaid continues to grow. In November 2019 Stanford University published a survey of American views on Pay for Performance. The survey found “Eighty-six percent of respondents believe the CEOs of large, public U.S. companies are overpaid; only 14 do not.”⁷ This number is a 3 percent increase from 83 percent in 2016, when Stanford found many respondents tremendously under-estimated the actual level of CEO pay, but still considered CEO pay excessive on the less-informed grounds of their estimates.
An analysis by The Wall Street Journal in May 2019 found that in the prior year median CEO pay rose to $12.4 million among the S&P 500 companies, up 6.6 percent from 2017.⁸
Even the 10 percent of the companies with the worst one-year shareholder returns had CEOs with median pay packages of $12.6 million. Study after study shows CEO pay moving upward. The Economic Policy Institute report found that from 1978 to 2018, inflation-adjusted CEO compensation based on realized stock options of the CEOs increased 940 percent. The increase was more than 25 to 33 percent greater than the stock market growth and, at 940 percent, substantially greater than the 11.9 percent growth in a typical worker’s annual pay over the same period.⁹
CEO pay is a core contributor to America’s extreme and growing income inequality. The headlines tell the story: From The Washington Post, “Income inequality in America is the highest it’s been since Census Bureau started tracking it, data shows,”¹⁰ or from The Huffington Post, “Just 162 Billionaires Have the Same Wealth as Half of Humanity,”¹¹ and another one from The Washington Post, “The massive triumph of the rich, illustrated by stunning new data.”¹² Concern about this income disparity is getting at least some lip service, a recent piece in The New York Times covered the 2020’s Davos Manifesto,¹³ including demands that corporations to pay their “fair share” of taxes, continuously improve the “well-being” of employees, and treat “executive remuneration” responsibly.
One of the companies on our Most Overpaid list this year is Boeing. CEO Dennis A. Muilenburg received total compensation of $23.4 million for 2018. Under his leadership Boeing cut corners on the 737 Max, resulting in two plane crashes and the loss of hundreds of lives. These crashes and the subsequent grounding of the 737 Max cost the company billions of dollars of value and, in 2019, Muilenburg was fired. He received a huge $62 million payment upon his departure. In a letter to the Boeing board questioning the proposed bonus for incoming CEO Dave Calhoun, Senators Edward Markey, Richard Blumenthal, and Tammy Baldwin wrote “In pursuit of profit, Boeing rushed the design, production, and certification of the 737 MAX.” 14
Even though two plane crashes killing 386 people and the resulting crash of Boeing’s stock price occurred prior to the 2019 annual meeting, the CEO pay proposal was supported at that meeting by 93.2 percent of shareholder votes.
Financial managers who voted the shares that they controlled against Muilenberg’s CEO pay package included BNY Mellon, JP Morgan, and Parametric. BMO Global Asset Management voted against the package based on concerns with the incentive awards, according to description on Proxy Insight, and added, “We encourage the company to consider its clawback options pending the substantial revenue booked this year on the sales of aircraft that have since been recalled.” The Florida SBA voted against the package based on insufficient disclosure of STIP (short term incentive plan) and LTIP (long term incentive plan) performance goals. The largest shareholder BlackRock, who controlled 6 percent of the shares at the time, voted in favor of Muilenburg’s CEO pay package.
In January 2020, the company disclosed the package in which Muilenberg would receive $62.2 million as he departed the company. It also disclosed its agreement with long-term board member and incoming CEO David L. Calhoun. 15
Shareholders will not vote on that agreement until this spring. The agreement includes a promised bonus based on returning the 737 Max to service. As the Senators noted in their letter, “This payment represents a clear financial incentive for Mr. Calhoun to pressure regulators into ungrounding the 737 Max, as well as rush the investigations and reforms needed to guarantee public safety.”16
As we publish our 2020 report, CEO pay is receiving intense political focus. The Tax Excessive CEO Pay Act proposed in the House by Rep. Barbara Lee (D-Calif.) and Rep. Rashida Tlaib (D-MI) calls for the federal corporate tax rate to be linked to the ratio of CEO to median worker pay, with a larger gap triggering a higher tax.¹⁷ Similar legislation was introduced in the Senate by Bernie Sanders (I-VT) who was quoted in The New York Times as saying, “It is time to send a message to corporate America: If you do not end your greed and corruption, we will end it for you.”¹⁸ Presidential candidate Elizabeth Warren has co-sponsored this bill.
On January 15, 2020, SB 37, a California bill linking a high CEO to worker pay ratio to the California corporate income tax rate passed the California State Senate Finance committee. Sponsoring Senator Nancy Skinner said, “It’s designed to incentivize big corporations to start paying workers a fair wage.”¹⁹ In 2017, the city of Portland, Oregon implemented a surcharge on CEO Pay that exceeds 100 times the median pay of the company’s workers.²⁰ This Pay Ratio Surtax ²¹ applies to any public company with offices or staff in Portland, covering 540 big corporations, including NIKE and Wells Fargo.
HOW WE IDENTIFY THE 100 MOST OVERPAID CEOS
Each year we evaluate CEO pay at all S&P 500 companies using data provided by Institutional Shareholder Services (ISS). We also use data provided by HIP Investor that uses a statistical regression model to compute what the pay of the CEO would be, assuming such pay is related to cumulative total shareholder return (TSR) over the previous five years. This provides a formula to calculate the amount of excess pay a CEO receives. To this we add data that ranks companies by what percent of company shares were voted against the CEO pay package. Finally, we rank companies by the pay ratio between CEO’s pay, and the pay of the median company employee.
The rankings of companies by excess CEO pay and by shareholder votes on CEO pay are weighted at 40 percent each. The final ranking, based on CEO to worker pay ratio, is weighted at 20 percent. The complete list of the 100 most overpaid CEOs using this methodology is found in Appendix A. The regression analysis of predicted and excess pay calculated by HIP Investor is found in Appendix C, and its methodology is explained in further detail there.
Figure 1 presents the 25 Most Overpaid CEOs. The full list of 100 is in Appendix A.
THE SHAREHOLDER RESPONSE TO EXCESSIVE CEO COMPENSATION
In 2011, under section 951 of the Dodd-Frank Act, companies have been required to allow shareholders to vote on the pay of the CEO, and the four other top corporate officers, in addition to electing the corporation’s board of directors and weighing in on various shareholder proposals. Since that time, opposition to high CEO pay has been growing and more companies have seen their CEO pay packages receive less support from their shareholders. Shares held by U.S. public pension funds and European financial fund managers have made their opposition to excess CEO pay clear.
Even so, the level of shareholder opposition does not yet reflect broader attitudes toward CEO pay. Andrew Edgecliff-Johnson in a Financial Times opinion piece suggests that such shareholder votes “. . . may have blinded compensation committees to how non-shareholders see the ever increasing rewards for corporate leaders.”²²
PROXY ADVISORS AND PROPOSED NEW SEC RULES
Financial managers often rely on proxy advisors to evaluate CEO pay packages. Though evidence has shown that financial fund managers do not blindly follow the advisors’ recommendations (particularly when they suggest voting against the pay of the CEO), companies have often blamed the advisors rather than themselves for low shareholder support for CEO pay packages.
A new SEC proposed rule would require any proxy advisory service to submit a draft of proxy voting advice for review by the company before the advice can be issued. By giving the companies more time to review the advice, they are giving the advisor’s clients, the financial fund managers, less time.
In his statement on release of the rule SEC Commissioner Robert J. Jackson Jr. wrote, “Consider a proxy advisor deciding how to advise shareholders in a proxy fight driven by poor performance. Recommending that investors support management comes with few additional costs under today’s proposal. But firms recommending a vote against executives must now give their analysis to management, include executives’ objections in their final report, and risk federal securities litigation over their methodology. Taxing anti-management advice in this way makes it easier for insiders to run public companies in a way that favors their own private interests over those of ordinary investors.”²³ The same would be true, of course, for any compensation proposal.
First Affirmative, in a comment letter on the topic writes, “We are particularly concerned that a product we pay for – impartial and comprehensive company research – will be subject to review and potential amendment by the very companies that are under review before we, the paying customer, ever receives the product.”²⁴ First Affirmative also cites an editorial by Kurt N. Schacht, for CFA Institute’s advocacy group:
“[...] we do enormous damage to the honesty and integrity of markets when we let issuers try to modulate negative advice or subvert opinions in the guise of fact-checking. It is dangerously close to regulating an analyst’s buy/sell opinions on a stock. It is as much a Constitutional right for investment managers to hear the unexpurgated views of professional analysts as it is for the issuers to state their own case. We wish it were not so, but this proxy proposal by any other name is analyst retaliation.”²⁵
The two largest proxy advisors are Institutional Shareholder Services (ISS) and Glass Lewis, but there are also several smaller advisors, such as Egan-Jones, Segal Marco and PIRC.
ISS uses what they term “a quantitative degree-of-alignment scale” to evaluate CEO pay and company performance. In 2019, ISS recommended voting against 11 percent of the CEO pay packages at S&P 500 companies, and 32 of the 100 most overpaid CEOs. This represents little change year over year. These numbers are based on the default ISS “standard” policy. ISS also offers different voting recommendations based on other policies that may more accurately reflect the views of different sets of investors, and financial fund managers. For example, a policy developed for pension funds operating under the Taft Hartley Act recommends voting against 51 of the 100 most overpaid CEO pay packages. Another policy designed to appeal to “Socially Responsible Investors” recommends voting against just 33 of the 100 most overpaid CEOs. Many users of ISS proxy voting services take advantage of ISS’s ability to create their own custom policies. In the case of CEO pay, these custom policies can produce substantial differences from the standard ISS recommendations.
Glass Lewis, which can also create custom policies, uses a model comparing CEO pay in relation to company peers, and company performance compared to peers, and awards letter grades between A and F. An “A” means that the percentile rank for compensation is significantly less than its percentile rank for company performance. For 2020 Glass Lewis has announced that the model will introduce an enhanced peer group methodology that is proprietary to Glass Lewis and leverages the global compensation data and analytics tools of CGLytics. In 2019, Glass Lewis recommended shareholders vote against 10 percent of the CEO pay packages at S&P 500 companies, and 32 percent of the 100 most overpaid CEOs.
Egan-Jones Proxy Services creates a proprietary EJPS Compensation Rating for each company that begins with a quantitative raw score of “wealth creation” that relates CEO pay and company performance. The company is then compared to peers, and ranked by quintile as “Needs attention,” “some concerns,” “neutral,” “good,” or “superior.”²⁶ Egan-Jones then considers qualitative adjustment factors. Egan-Jones recommended voting against 44 percent of the 100 most overpaid CEOs.
When analyzing compensation, Segal Marco conducts a first screen to identify corporations with good financial performance and less-than-anticipated pay. Those companies typically receive a “yes” vote on CEO pay packages. Those that don’t meet criteria, receive a secondary screening on a variety of pay practices (from accelerated vesting to gross-ups). Segal Marco recommended that shareholders vote against 42 percent of the CEO pay packages at S&P 500 companies, and 70 percent of the 100 most overpaid CEOs. Maureen O’Brien, vice president and director of corporate governance for Segal Marco, notes that the Segal Marco Advisors cast votes for 84 pension funds that subscribe directly for proxy voting and corporate governance service, and that there are additional funds that receive consulting or discretionary services from them.
Pensions and Investment Research Consultants (PIRC) one of the largest proxy advisors in Europe, recommended voting against all of the 100 most overpaid CEOs in its portfolio. PIRC was founded in 1986 and is “Europe’s largest independent corporate governance and shareholder advisory consultancy.”²⁷
A key objective of this report is to analyze the voting practices of the managers of mutual funds and ETFs at annual shareholder meetings. This analysis will highlight which managers are properly exercising their fiduciary duty, and which ones are blindly following the recommendation of management to approve excessive CEO pay packages. As shown in Figure 2, this year 7 of the 25 largest financial fund managers voted against more than half of the 100 overpaid CEOs pay packages.

The three largest financial managers, (BlackRock, Vanguard, and State Street) are the largest shareholders in the vast majority of S&P 500 companies. Each of them holds between five and ten percent of each company. A recent Bloomberg report noted that 22 percent of the shares of the typical S&P 500 company are held by them, up from 13.5 percent in 2008.²⁸
A Reuters analysis of proxy voting at 300 of the worst-performing companies in the Russell 3000 index found that, “BlackRock voted with management 93 percent of the time, followed by Vanguard at 91 percent, and State Street at 84 percent during the proxy year ended June 30, 2018.”²⁹
In December 2019, Jeff Sommer of The New York Times had Jackie Cooke, who directs Morningstar’s research on investment stewardship, analyze every vote cast by large mutual funds in 2019. Morningstar found that, “...while index funds offered by different companies were often nearly indistinguishable in fees and performance, the voting behavior of the funds was very different.”³⁰ The analysis found BlackRock and Vanguard as the most inclined to follow what management says, very different from BNY Mellon, Prudential, UBS, Aberdeen and Allianz.
Many of these large financial managers operate passive funds that may invest in every company within the index, regardless of how well or poorly the company is run. Thus, if they find something wrong with the company, they do not sell shares. As Reuters notes, this “...leaves proxy voting as the primary leverage for index fund firms to hold companies accountable for practices that undermine shareholders’ interests, such as exorbitant executive pay.”³¹
BlackRock – $7,430 billion AUM
BlackRock, the largest fund manager measured by AUM, manages a significant share of money from “institutional” investors, and is receiving increasing attention regarding how it votes.
BlackRock voted against 3 percent of the CEO pay packages of the S&P 500 companies; it voted against 8 percent of the 100 most overpaid CEO pay packages.
BlackRock’s 2019 Investment Stewardship Annual Report is beautifully designed with numbers, but presented without sufficient meaning or context. BlackRock provides information on numbers of companies “engaged,” percentage of companies with multiple engagements, and percent of equity assets engaged. It does not detail any understandings, successes or failures that came from those engagements, or how it voted its shares at company meetings on CEO pay, or any other issue.
The stewardship report has section titled, “Executive Compensation: The Role of Public Company Shareholders” that says, “Executive compensation is often cited as an example of how index fund managers can wield outsized control over corporations because as public company shareholders, they can participate in Say on Pay votes on behalf of their clients. This misperception reflects a lack of understanding of how executive compensation is determined and what Say on Pay votes actually entail. Say on Pay votes permit shareholders to express their views on executive compensation, but they do not dictate how much executives will be paid.”³²
Using data from Proxy Insight, we looked at all 105 of BlackRock’s votes against CEO pay advisory compensation at U.S. companies, and at the level of CEO compensation at those companies. We found that BlackRock voted against CEO pay more frequently at companies whose CEOs were paid less than $5 million (more than 60 firms), than they did at companies with CEOs paid over $20 million (15 firms). More than half of our list of 100 Overpaid CEOs had pay higher than $20 million last year, and BlackRock voted against only five of them this year.
BlackRock notes that this year it “engaged” with nearly 600 companies on compensation practices and tracks the change in shareholder support for the 458 of these companies that had say on pay votes. “Of those 458, 211 (46 percent) companies saw year-over-year increases in voting support. Furthermore, 93 of the 211 (44 percent) companies received a 10 percent or greater increase in support for their Say on Pay proposal.”³³
First consider the inverse of the figures provided: 54 percent of the companies it engaged with had the same, or decreased levels of shareholder support, for the pay of the CEO. However, increased level of support, the feature BlackRock highlights as occurring at 46 percent of the companies it engaged with, is not proof of improved compensation governance. Second, consider what is not disclosed: specifics on problems with the CEO pay package, responses and resulting changes, if any. BlackRock could have provided a figure as to how it voted, whether pay went up or down, what else changed, if anything.
Blackrock’s votes on climate issues have also been the subject of investor and media focus. In September 2019, Majority Action released a report “Climate in the Boardroom: How Asset Manager Voting Shaped Corporate Climate Action in 2019.” While focusing primarily on shareholder proposals related to climate, the report examined votes on management proposals at 49 companies as well. Among the findings was that BlackRock and Vanguard supported CEO pay packages at all U.S. large capitalization energy and utility companies. Indeed, “BlackRock and Vanguard not only voted with management more often than most of their asset manager peers; they were also more likely to support management at these fossil fuel intensive companies than they did across U.S. equities overall.”³⁴
General Electric will be studied for years as an example of a company where investors and the board failed to intervene in time. The stock was worth $30 per share at the end of December 2016; two years later it was trading for less than $10 a share. Rapid growth and acquisitions had been used for years to justify extraordinary pay and blurred the value of the company. Over five years, GE’s stock market value is down more than 50 percent, while the S&P 500 is up 60 percent.
As noted in the Wall Street Journal profile GE Powered the American Century – Then it Burned Out, General Electric has spent more than $45 billion in stock buybacks in the last decade. In 2017 it became evident that “GE had been sending money out the door to repurchase its stock and pay dividends but wasn’t bringing in enough from its regular operations to cover them. It wasn’t sustainable.” 35
In 2019, many shareholders objected to the pay-for-performance disconnect, provisions in a new employment agreement for executive officers, and one-off payments. Both ISS and Glass Lewis recommended against the proposal. Among those that voted against the pay package were the Arizona State Retirement System, British Columbia Investment Management, City of Philadelphia Board of Pensions and Retirement, the State Universities Retirement System of Illinois, and TIAA-CREF.
However, the largest shareholders, including BlackRock, Vanguard, Fidelity, and State Street all supported the proposal, despite the deep erosions of shareholder value.
Vanguard – $4,530 billion AUM
Vanguard has seen a great increase in size over the last several years, tripling its AUM since 2011. As noted by Robin Wigglesworth and Richard Henderson in Vanguard and the US Financial System: Too Big to Be Healthy, Vanguard now accounts for more than one-quarter of the retail US mutual fund market (nearly as much as BlackRock, Fidelity, and Capital Group combined).³⁶ Unlike BlackRock and State Street, it does not manage money for a significant a share of pension funds.
Vanguard voted against 4 percent of packages of the S&P 500 companies; it voted against 10 percent of the 100 most overpaid CEO pay packages.
Vanguard updated its proxy voting guidelines effective April 1, 2019. The new guidelines on CEO pay highlight three areas of concern: “Alignment of pay and performance, plan structure and ‘other considerations.’ In general, a fund will vote case-by-case on executive compensation proposals (including Say on Pay, remuneration reports, remuneration policies, etc.) and will support those that enhance long-term shareholder value. It will also vote for compensation proposals that reflect improvements in compensation practices if the proposals are not perfectly aligned with all of these guidelines but are clearly in the interests of long- term shareholder value.”³⁷
Vanguard’s Investment Stewardship 2019 Annual Report offers more useful data than the BlackRock report, including annual comparisons that show slightly increased opposition to pay packages. Vanguard reports that the funds voted on 5,768 CEO compensation proposals globally and supported 91 percent of them in the 2019 proxy year. While this represents a high level of support for high levels of CEO pay, it is notable that this level of support is less than Vanguard’s support of 93 percent of such proposals in 2018, and 97 percent in 2017.³⁸ Thus, the trend line is toward increasing opposition, though moving at a slow pace.
State Street Global Advisors - $2,810 billion AUM
State Street in its 2018-2019 Stewardship Report says, “We leverage the size and scope of our investments to have a meaningful impact on companies and help create long-term value on your behalf” and discloses how it undertakes this task. Each year State Street sets out specific sectors and issues that will be its primary focus. Those issues are discussed in great depth. The report includes a section entitled “Impact of Engagement” where State Street details specific discussions they were involved in regarding the quantum of pay (at Walt Disney Corporation) and improving the structure of compensation plans (at CVS).³⁹ This report is the only one from the three largest financial managers that includes an appendix specifically detailing which companies were engaged with, and what topics come up in particular discussions.
One figure shows the top five reasons “...driving our rationale on pay proposals..,”: poor disclosure (32 percent); poor structure (31 percent); overall compensation matters (14 percent); excessive pay (12 percent) and one-off payments (4 percent).⁴⁰
State Street voted against 5 percent of packages of the S&P 500 companies, and abstained on an additional 5 percent; it voted against 15 percent of the 100 Most Overpaid CEO pay packages, and abstained on an additional 13 percent.
State Street is increasing its policy of abstaining, believing that abstaining indicates dissatisfaction with the CEO pay package.
During the time frame covered in this report, State Street reports voting on 2,445 pay-related proposals in the U.S. and Canada, supporting 90 percent, abstaining from 4 percent and voting against 6 percent.
Sarasin & Partners LLP – $17 billion AUM
Sarasin voted against 89.6 percent of packages of the S&P 500 companies; it voted against 94 percent of the 100 most overpaid CEO pay packages.
London-based asset manager Sarasin & Partners LLP revamped its analysis of remuneration packages in 2017 after becoming convinced that the conventional mainstream design of executive compensation was not working. Natasha Landell-Mills, Head of Stewardship, in an essay “What has Gone Wrong with Pay and What Can Investors Do About it” wrote, “Chief executives are – broadly speaking – paid too much. This is our conclusion whether we are looking at pay for performance or data on absolute rent extracted by senior executives as a proportion of economic value created.”⁴¹
As a long-term investor, Sarasin noted that it had watched business cycles that drove stock down and then back up, but left investors no better off than before. At the same time, executives who rode out that same cycle were often excessively rewarded for simply seeing the stock price restored.
There are three characteristics Sarasin looks for in a good remuneration plan: simplicity, moderation, and long-term alignment with shareholders. The votes against this year were driven by one element of the policy in particular: that companies should have post-departure share ownership requirements that ensure that some portion of an executive’s equity is held by them following their departure from the company. According to Sarasin’s 2018 Stewardship Report “the primary reasons for our vote against remuneration schemes” in 2018 was “insufficient share ownership levels and our desire to see executives hold shares for up to two years after they depart.”⁴² While this issue has been gaining traction, Sarasin appears to be the leader in enshrining the requirement in its voting practices.
UBS Asset Management – $831 billion AUM
UBS Asset Management voted 65.3 percent of the S&P 500 companies; it voted against 76 percent of the 100 most overpaid CEO pay packages.
According to Proxy Insight, the firm increased its level of opposition on votes at S&P 500 companies by more than any other asset manager. Using the same base – S&P 500 companies – UBS opposed 26.3 percent of pay packages in 2018; in 2019 it opposed 72.8 percent (UBS’s own analysis differs slightly: the firm cites opposition of 67 percent in 2019.)
The change in voting practices stems from an update to the proxy voting guidelines effective March 1, 2019. The guidelines include 18 bullet points of common reasons, or concerns, that may cause UBS to “not support a remuneration scheme.”
In an email a spokesperson for UBS said votes against were driven in large part by:
Remuneration structures where long-term incentive plans do not have at least 50 percent of awards subject to performance conditions;
Remuneration structures where the potential value of short-terms awards is higher than the value of long-term awards.
For each element of guidance, UBS makes it clear that these are flags, and not triggers for automatic opposition. UBS says it may vote against a pay package:
If a salary increase greater than 10 percent has been awarded without a reasonable explanation.
Where the company uses discretion in awarding a one-off variable pay award without sufficient explanation.
Where there is an insufficient explanation for a retention or recruitment payment, or where a recruitment payment is not performance based.
In situations where the long-term incentive plan allows for re-testing, or the company amends performance criteria retrospectively during the term of the scheme.
If the company has used a benchmarking exercise as a reason to raise the pay of executives without wider explanation.
When the salary of an incoming Chief Executive is positioned higher than that of their predecessor without an adequate explanation.
Severance packages which exceed 2 years fixed salary plus average bonus pay.
AXA Investment Managers (AXA) – $821 billion AUM
AXA IM voted against 34 percent of packages of the S&P 500 companies; it voted against 51 percent of the 100 most overpaid CEO pay packages.
Last year AXA voted against less than 10 percent of the CEO pay packages. This year AXA voted against more than three times as many. In an email to As You Sow dated November 19, 2019, Irfan Patel noted that following multi-year private engagements AXA IM, “reviewed and toughened this approach in the US (and globally) at the start of 2019 demanding a stronger alignment between pay and performance.”
AXA IM told the Financial Times “Our approach targets those laggards where performance-linked pay is still underutilised and does not make up at least half of incentive awards granted.”⁴³
Azzad Asset Management – $0.7 billion AUM
Azzad voted against 70.6 percent of packages of the S&P 500 companies; it voted against 89 percent of the 100 most overpaid CEO pay packages.
Azzad Asset Management, a faith-based investment advisor that follows Islamic principles, significantly increased its opposition to CEO pay packages in 2019. In 2018, Azzad held 56 S&P 500 companies in their portfolio, and approved the CEO pay package at all of them. Amina Rubin, Senior Marketing Specialist, said that the fund had initially focused its philosophy in the screening of companies for its portfolio, and voting on shareholder proposals. Thus, it voted routinely to support management on resolutions including board elections and CEO pay.
However, Rubin, notes, the perspective evolved, particularly after attending As You Sow’s Overpaid CEOs webinars. In 2019, they voted against CEO pay at 73.3 percent of the 56 S&P 500 companies held in their portfolio.
In announcing changes to its proxy voting guidelines Azzad pointed out, “Corporations have a role to play in some of the most significant challenges in the United States – from income inequality to climate change.” Azzad identified “Ensuring responsible executive compensation and corporate accountability” as one of its three focus issues.⁴⁴
The fund is still relatively small, with an AUM of $700 million, but has been going through a period of rapid growth.
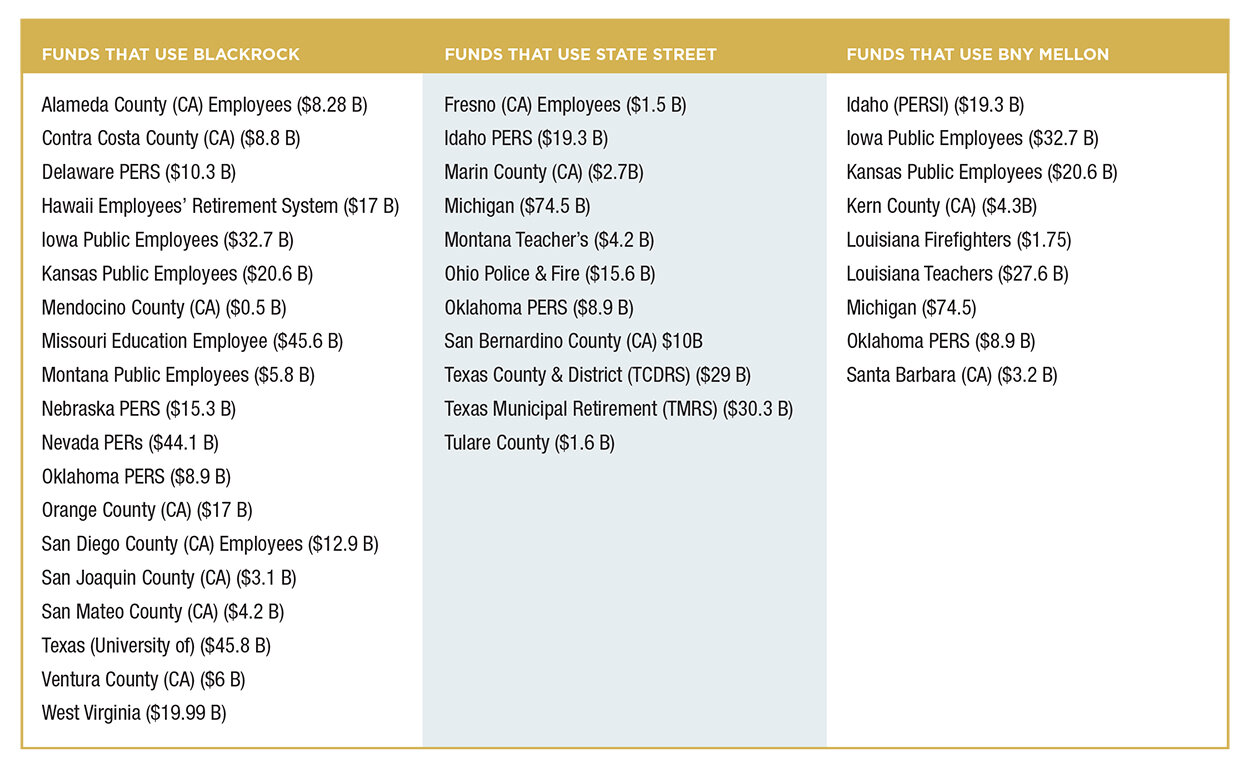
As noted under key findings, many pension funds use external financial managers and typically allow those managers to vote their shares for them. Using both Proxy Insight and our own independent research, we identified financial managers used by pension funds. The lists below include the full AUMs for the entire pension fund, not that component designated to specific fund managers or even to equity. Also, as we note below, many funds use more than one manager.
Blackrock, the largest financial manager in the world, voted against only 3 percent of the S&P 500 CEO pay packages.
There are other financial managers that public pension funds can select who exercise stronger voting governance than BlackRock. For example, compared to Blackrock, BNY Mellon voted against almost nine times as many S&P 500 CEO pay packages, over 27 percent.
In some cases, a pension fund may have money managed by both BlackRock and another financial manager, who may vote differently than BlackRock. For example, Oklahoma PERS uses both State Street and BNY Mellon, as well as Blackrock, so some of its shares are voting against a particular CEO pay package, and others are voting for it.
Wyoming and Nevada use AllianceBernstein which voted against 11.41 percent of CEO pay packages of the S&P 500 companies; and voted against 37 percent of the 100 most overpaid CEO pay packages.
Halliburton’s three-year TSR was minus 21 percent and the stock is now trading close to its five year low.
Halliburton is an example of how a large company can lobby shareholders to support its pay package. In 2018 most shareholders voted against CEO Jeffrey Miller’s pay of $23 million.
In response to that failed Say-on-Pay vote, the company met with investors. Members of the compensation committee, including the Chair, participated in those meetings. Miller’s total pay was reduced to $17 million. However, the reduction was in stock awards. His cash pay, including his salary, increased. The new pay is still excessive. A regression analysis of predicted pay based on TSR performed by HIP Investor estimated that Miller received an excess pay of nearly $6.5 million.
Many of the issues that had bothered shareholders the year before remained. While the company did eliminate some perquisites that are considered bad practice (including country club dues and tax gross-ups on corporate aircraft) the cost of these reported in the proxy statement was relatively minor. The dollar value of “all other compensation” which includes perquisites – increased year over year.
Three of the four shareholders with the largest stake in the company, Vanguard, Capital Group, and State Street voted against the proposal. Blackrock voted in favor.
This year there were 15 pension funds that voted against the pay of more than half of the CEOs on our list of the 100 most overpaid CEOs. A few of those with rigorous policies are profiled below. One fund that stands out is the Employee Retirement System of Georgia (ERSG). ERSG has a policy to “vote and execute all voting proxies in support of management.”⁴⁵ They are the only pension fund that votes in favor of absolutely every CEO pay package.
CalPERS – $396 billion AUM
CalPERS voted against 50.4 percent of CEO pay packages of the S&P 500 companies; it voted against 76.7 percent of the 100 most overpaid CEO pay packages.
CalPERS’s role as a leader on the compensation issue continues to grow. In 2019, we reported on the steep increase of opposition to pay that occurred between proxy seasons 2017 and 2018. The level of opposition increased further in 2019. The first version of CalPERS’ pay for performance framework was implemented in January 2018, and a new proprietary five-year quantitative pay- for-performance model was implemented in March 2019, and finally the CalPERS P4P Scorecard was introduced in August 2019.
In September Equilar released the CalPERS P4P Scorecard⁴⁶on Equilar Insight, a leading executive compensation benchmarking software solution. The scorecard calculates a CEO’s realizable pay over a five-year period and compares that to the shareholders’ gain over that same timeframe. Its availability to Equilar subscribers will make more broadly accessible and adoptable by others.
CalPERS’ Executive Compensation Analysis Framework provides details on the scorecard calculation. Specifically, a Financial Outcomes Spread is calculated, based on the Shareholder Financial Outcome minus the CEO Financial Outcome (using CalPERS realizable pay methodology). The spread reflects how much better or worse off the financial experience of shareholders is relative to that of the CEO. The quantitative analysis is coupled with a qualitative analysis, which includes elements similar to other guidelines.
A few specifics are notable. CalPERs considers the use of adjusted metrics, or non-GAAP metrics, on compensation plans (without sufficient justification and prominent disclosure of the reconciliation) to be problematic, noting that Generally Accepted Accounting Principles (GAAP) accounting “...is appropriate for consistency and comparability.”⁴⁷
In addition, CalPERs has stated a preference for holding periods under which executives should be “...permitted to sell no more than 20 percent of net after tax vested equity per year starting in the 6th year after grant date. In addition to the longer holding period requirements during employment, we also prefer longer post-separation holding periods – such as two years – to discourage short-term focus ahead of separation.”⁴⁸
This is only one example of how CalPERS takes a longer view than many funds. “Over one, two, or three years performance might look good, but over 10 years, the relationship sometimes just isn’t there,”⁴⁹ Simiso Nzima, Investment Director & Head of Corporate Governance at CalPERS said in a Bloomberg article CalPERS Ups Pressure on Companies Over Executive Pay, Harassment.
These changes are a component of the longer view the pension fund takes which incorporates sustainability in its analyses. Anne Simpson, investment director at CalPERS, told the Financial Times, “The long-term drivers of risk and return ride on companies’ ability to manage their human capital, their physical resources. It is not enough simply to deploy finance with flair.”⁵⁰
Macy’s CEO Jeffrey Genette’s compensation last year was $12.7 million. This was 582 times that of the median employee who earned only $21,885 in 2018. In other words, close to half of all Macy’s employees took home less than $20,000 in a year. Like many large retailers, over the past several years, the company has struggled financially. The five-year average TSR for the period ending 12/31/19 was minus 19.8 percent. Yet despite the declining stock price, Genette received annual bonuses in each of the last two years.
As Achmea Investment Management pointed out in its explanation for voting against the CEO pay package, “annual incentive awards were earned above target after financial goals were set below actual results in 2017.” In other words, going into the year Genette was told he would get a bonus if the company performed worse than it had the prior year.
This may have been a factor in why funds such as Parnassus, Legal & General Investment Management, Allianz, Canada Pension Plan Investment Board, and others voted against.
However, the nine largest investors – including Vanguard, BlackRock, First Eagle Investment, Harris Associates, and State Street Funds Management, which together owned half the shares – each voted in favor of the pay package.
BRITISH COLUMBIA – $146 billion AUM
British Columbia voted against 32.5 percent of the CEO pay packages of the S&P 500 companies; it voted against 62.6 percent of the 100 most overpaid CEO pay packages.
In its report “ESG Engagement in Public Markets” BCI reports that next to the election of directors, “BCI spends the most time analyzing executive compensation programs.”⁵¹
According to its 2019 proxy voting guidelines, BCI generally will vote against compensation structures that:⁵²
Do not emphasize a pay for performance philosophy, with linkage to protecting and building long-term shareholder value Provide largely discretionary and/or guaranteed forms of comp
Do not provide clear and comprehensive disclosure that enables shareholders to evaluate the pay for performance linkage Targets pay above the median of peer
Uses narrow or duplicative metrics in both the long term and short term plans
Provide for excessive pay levels or contractual arrangements
Rely excessively on stock options with no associated performance conditions; or
Lack sufficient risk mitigation features.
While Canadian companies are not required to allow shareholders to vote on pay, Canadian investors continue to urge companies to voluntarily adopt such proposals. Advocating for say on pay proposals in Canada is one of the two main engagement activities around compensation outlined in BCI’s 2018 Responsible Investing Annual Report. This is done both through “...encourage[ing] regulators and security commissioners to mandate”⁵³ such a vote and encouraging voluntary adoption at companies that do not have such a vote. BCI reports that the number of NSX companies that hold a voluntary vote has increased by 113 percent from 2012 to 2018, from 76 to 162 companies.
RHODE ISLAND – $8 billion AUM
Rhode Island voted against 27 percent of CEO pay packages of the S&P 500 companies; it voted against 54 percent of the 100 Most Overpaid CEO pay packages.
As we noted in last year’s report, Rhode Island did a significant rewrite of their guidelines in 2018. In 2018 their level of opposition to pay at S&P 500 companies was only 12.6 percent. In 2019, the fund voted against pay at more than half of the S&P 500 companies in its portfolio. The 2019 Shareholder Engagement Overview notes, “It is in the best interest of members of the Rhode Island pension system that executive compensation incentivize management to focus on long term, sustainable corporate growth, rather than rewarding short-term risk taking, which was a significant factor in the 2008-2009 financial crisis.”⁵⁴
“At a time when income inequality has grown to alarming levels in our country, investors like the pension fund should not be paying enormous salaries to corporate executives at companies that are performing poorly,” said Seth Magaziner, General Treasurer for the State of Rhode Island. “Executive compensation must be closely tied to long-term performance and structured in a manner that keeps corporate executives accountable to investors, including members of our pension system.”⁵⁵
The strategy for holding corporations accountable for excessive CEO pay continues to be refined. Shareholders have had the right to vote on compensation since 2011 and this tool that Dodd-Frank offered is being utilized more fiercely. Before we began researching and writing this report it was challenging to have insight into how funds voted. Now, six years later, we have a clear set of leaders and laggards, and are witnessing the funds learning from each other. I am proud we’ve built a forum that encourages improved say on pay voting patterns.
In voting on CEO pay, U.S. financial managers do worse than European ones, and this is particularly the case with the largest financial managers which manage sizable index funds. It is time for those funds to do better.
There may be no company where the release of the pay ratio information caused more consternation than at the Walt Disney Company. The median employee in 2018 earned $46,127. The CEO’s pay was $65,645,214. The pay ratio to median employee was 1,424:1. When employees, forced to sleep in their cars because they could not afford rent, reached out to the Abigail Disney – a member of the family – she took up their cause and wrote an editorial in The Washington Post, It is time to call out Disney – and anyone else getting rich off their workers’ backs.
Shareholders were also angry. At the company’s meeting in 2018, an astonishing 54 percent of shareholders objected to the contract Disney offered to their CEO. On March 4, 2019 just a few days before their March 7 annual meeting, Robert Iger agreed to a reduction of salary and guaranteed bonus of $13.5 million.
The board had already responded to the 2018 vote by amending the contract to address the treatment of some performance shares in the $100 million equity grant. Nevertheless, both ISS and Glass Lewis recommended against the CEO pay package, contending that those changes were not enough. The fact that the company made another change so close to the vote, suggests that perhaps the board was talking to some of their largest shareholders about their vote up to the last minute.
In the vote following the change, 41.3 percent of shareholders cast their vote against the package, and another 3.5 percent abstained. Vanguard, BNY Mellon and T. Rowe Price were the largest Disney shareholders that voted against the plan in 2018 and supported it in 2019.
Disney’s compensation changes illustrate how desperately companies want to avoid having a majority of votes cast against their compensation plans. Disney has lowered CEO Iger’s pay in the package that will be voted on in the upcoming March 2020 annual meeting.56 Disney has lagged the S&P 500 and only recently is approaching the cumulative five-year performance of the index.
| RANK | COMPANY | CEO | PAY | EXCESS | VOTES AGAINST CEO PAY | CEO:WORKERS PAY RATIO | MEDIAN WORKER PAY |
|---|---|---|---|---|---|---|---|
| 1 | Oracle | Mark Hurd & Safra A. Catz | $216,577,356 | $204,041,604 | 46.08% | 1,205:1 | $89,887 |
| 2 | Align Technology | Joseph Hogan | $41,758,338 | $27,119,793 | 55.34% | 3,168:1 | $13,180 |
| 3 | Walt Disney | Robert Iger | $65,645,214 | $52,879,054 | 41.33% | 1,424:1 | $46,127 |
| 4 | Discovery | David Zaslav | $129,499,005 | $117,904,497 | 30.60% | 1,511:1 | $85,704 |
| 5 | CenturyLink | Jeffrey Storey | $35,655,646 | $24,692,688 | 59.42% | 527:1 | $68,674 |
| 6 | PayPal Holdings | Daniel Schulman | $37,764,588 | $23,111,708 | 44.91% | 543:1 | $69,600 |
| 7 | Gap (The) | Arthur Peck | $20,793,939 | $9,824,923 | 43.14% | 3,566:1 | $5,831 |
| 8 | Hologic | Stephen MacMillan | $42,040,142 | $29,140,855 | 34.37% | 478:1 | $87,845 |
| 9 | Chipotle Mexican Grill | Brian Niccol | $33,520,940 | $21,303,091 | 25.96% | 2,450:1 | $13,779 |
| 10 | Xerox | Giovanni Visentin | $23,459,003 | $11,210,989 | 59.78% | 544:1 | $43,953 |
| 11 | Dover | Richard Joseph Tobin | $27,931,401 | $15,383,675 | 33.06% | 661:1 | $42,889 |
| 12 | JP Morgan Chase & Co | James Dimon | $30,033,745 | $16,873,275 | 28.06% | 381:1 | $78,923 |
| 13 | Comcast | Brian Roberts | $35,026,207 | $22,289,763 | 19.82% | 426:1 | $82,205 |
| 14 | Transdigm Group Incorporated | Kevin Stein | $23,471,608 | $9,523,055 | 32.52% | 502:1 | $46,742 |
| 15 | Ameriprise Financial | James Cracchiolo | $25,742,524 | $13,365,224 | 66.12% | 272:1 | $94,570 |
| 16 | Centene | Michael Neidorff | $26,122,414 | $12,561,836 | 27.10% | 396:1 | $66,021 |
| 17 | American International Group | Brian Duperreault | $20,854,669 | $8,842,034 | 45.34% | 314:1 | $66,440 |
| 18 | Electronic Arts | Andrew Wilson | $35,728,764 | $22,136,782 | 13.79% | 371:1 | $96,336 |
| 19 | Activision Blizzard | Robert Kotick | $30,841,004 | $17,690,392 | 17.98% | 319:1 | $96,726 |
| 20 | Nielsen Holdings | David Kenny | $19,804,677 | $8,723,111 | 28.96% | 371:1 | $29,055 |
| 21 | Kraft Heinz | Bernardo Hees | $27,692,849 | $17,256,378 | 10.40% | 610:1 | $47,612 |
| 22 | Netflix | Reed Hastings | $36,080,417 | $21,076,497 | 50.03% | 178:1 | $202,335 |
| 23 | Jefferies Financial Group | Richard Handler | $44,674,213 | $33,110,837 | 14.44% | 298:1 | $150,000 |
| 24 | Western Digital | Stephen Milligan | $19,738,381 | $8,554,205 | 11.82% | 1,795:1 | $10,999 |
| 25 | Regeneron | Leonard Schleifer | $26,520,555 | $14,469,330 | 32.90% | 198:1 | $134,115 |
| 26 | Ralph Lauren | Patrice Louvet | $23,792,036 | $12,250,434 | 9.42% | 1,111:1 | $22,913 |
| 27 | Estee Lauder Companies (The) | Fabrizio Freda | $48,753,819 | $35,292,584 | 7.87% | 1,690:1 | $28,845 |
| 28 | Johnson & Johnson | Alex Gorsky | $20,097,572 | $7,551,949 | 33.95% | 268:1 | $75,000 |
| 29 | Arconic | Charles Blankenship Jr. | $17,657,207 | $6,054,790 | 31.74% | 353:1 | $50,232 |
| 30 | DaVita Inc | Kent Thiry | $32,017,501 | $20,477,984 | 8.87% | 526:1 | $60,889 |
| 31 | ProLogis | Hamid Moghadam | $28,201,400 | $14,976,943 | 15.89% | 244:1 | $115,368 |
| 32 | DXC Technology | J. Michael Lawrie | $32,185,309 | $18,781,112 | 9.01% | 404:1 | $79,604 |
| 33 | CVS Health | Larry Merlo | $21,939,098 | $10,349,026 | 9.31% | 618:1 | $35,529 |
| 34 | Omnicom Group | John Wren | $23,945,128 | $11,615,132 | 8.88% | 567:1 | $42,206 |
| 35 | Walmart | C. Douglas McMillon | $23,618,233 | $10,924,323 | 8.33% | 1,076:1 | $21,952 |
| 36 | Archer-Daniels-Midland | Juan Luciano | $19,637,534 | $7,644,395 | 13.09% | 385:1 | $51,087 |
| 37 | McKesson | John Hammergren | $18,143,017 | $6,653,137 | 13.25% | 473:1 | $38,370 |
| 38 | Newell Brands | Michael Polk | $15,547,207 | $4,431,337 | 29.98% | 448:1 | $34,688 |
| 39 | Mondelez International | Dirk Van de Put | $14,969,900 | $2,374,465 | 44.05% | 489:1 | $30,639 |
| 40 | AT&T | Randall Stephenson | $29,118,118 | $16,892,888 | 9.05% | 304:1 | $95,814 |
| 41 | QUALCOMM | Steven Mollenkopf | $19,975,472 | $7,875,974 | 20.57% | 233:1 | $85,592 |
| 42 | Halliburton | Jeffrey Miller | $16,999,898 | $6,490,140 | 37.32% | 193:1 | $88,244 |
| 43 | General Electric | H. Lawrence Culp Jr. | $15,398,827 | $4,500,411 | 29.60% | 345:1 | $58,204 |
| 44 | Booking Holdings | Glenn Fogel | $20,459,184 | $7,879,197 | 9.77% | 402:1 | $50,937 |
| 45 | Equifax | Mark Begor | $20,013,712 | $7,039,194 | 13.59% | 305:1 | $68,733 |
| 46 | International Business Machines (IBM) | Virginia Rometty | $17,552,218 | $5,777,027 | 12.22% | 319:1 | $55,088 |
| 47 | Citigroup | Michael Corbat | $24,183,714 | $11,579,052 | 7.37% | 486:1 | $49,766 |
| 48 | Hilton Worldwide Holdings | Christopher Nassetta | $19,790,569 | $6,747,875 | 8.35% | 542:1 | $36,530 |
| 49 | HCA Healthcare | R. Milton Johnson | $21,419,906 | $8,086,522 | 7.95% | 383:1 | $55,977 |
| 50 | Cisco Systems | Charles Robbins | $21,284,339 | $7,851,795 | 17.81% | 160:1 | $132,764 |
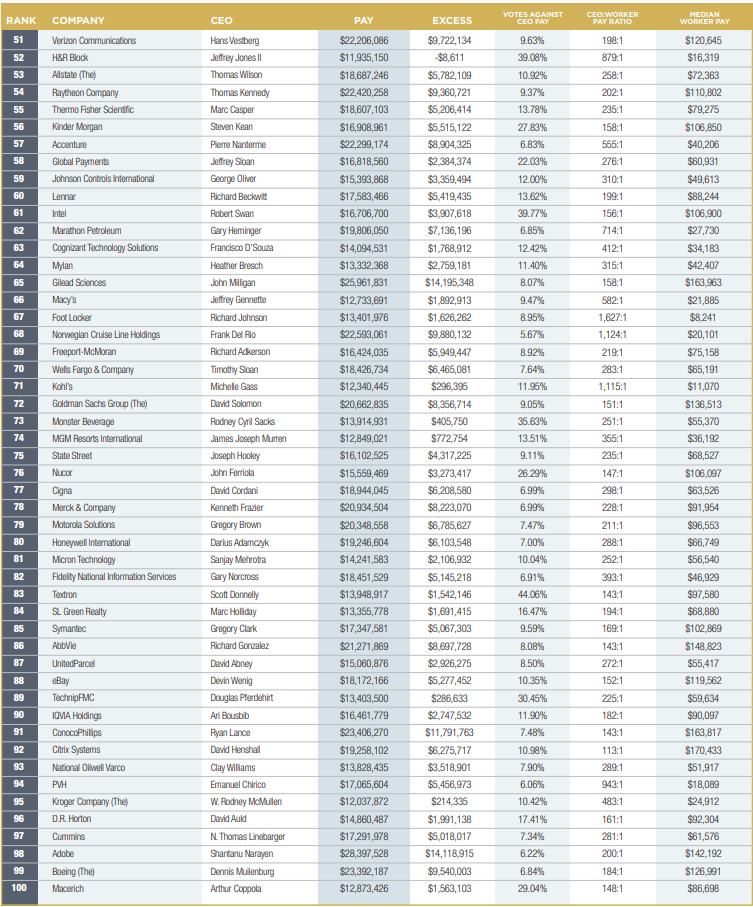
| 51 | Verizon Communications | Hans Vestberg | $22,206,086 | $9,722,134 | 9.63% | 198:1 | $120,645 |
| 52 | H&R Block | Jeffrey Jones II | $11,935,150 | -$8,611 | 39.08% | 879:1 | $16,319 |
| 53 | Allstate (The) | Thomas Wilson | $18,687,246 | $5,782,109 | 10.92% | 258:1 | $72,363 |
| 54 | Raytheon Company | Thomas Kennedy | $22,420,258 | $9,360,721 | 9.37% | 202:1 | $110,802 |
| 55 | Thermo Fisher Scientific | Marc Casper | $18,607,103 | $5,206,414 | 13.78% | 235:1 | $79,275 |
| 56 | Kinder Morgan | Steven Kean | $16,908,961 | $5,515,122 | 27.83% | 158:1 | $106,850 |
| 57 | Accenture | Pierre Nanterme | $22,299,174 | $8,904,325 | 6.83% | 555:1 | $40,206 |
| 58 | Global Payments | Jeffrey Sloan | $16,818,560 | $2,384,374 | 22.03% | 276:1 | $60,931 |
| 59 | Johnson Controls International | George Oliver | $15,393,868 | $3,359,494 | 12.00% | 310:1 | $49,613 |
| 60 | Lennar | Richard Beckwitt | $17,583,466 | $5,419,435 | 13.62% | 199:1 | $88,244 |
| 61 | Intel | Robert Swan | $16,706,700 | $3,907,618 | 39.77% | 156:1 | $106,900 |
| 62 | Marathon Petroleum | Gary Heminger | $19,806,050 | $7,136,196 | 6.85% | 714:1 | $27,730 |
| 63 | Cognizant Technology Solutions | Francisco D’Souza | $14,094,531 | $1,768,912 | 12.42% | 412:1 | $34,183 |
| 64 | Mylan | Heather Bresch | $13,332,368 | $2,759,181 | 11.40% | 315:1 | $42,407 |
| 65 | Gilead Sciences | John Milligan | $25,961,831 | $14,195,348 | 8.07% | 158:1 | $163,963 |
| 66 | Macy’s | Jeffrey Gennette | $12,733,691 | $1,892,913 | 9.47% | 582:1 | $21,885 |
| 67 | Foot Locker | Richard Johnson | $13,401,976 | $1,626,262 | 8.95% | 1,627:1 | $8,241 |
| 68 | Norwegian Cruise Line Holdings | Frank Del Rio | $22,593,061 | $9,880,132 | 5.67% | 1,124:1 | $20,101 |
| 69 | Freeport-McMoran | Richard Adkerson | $16,424,035 | $5,949,447 | 8.92% | 219:1 | $75,158 |
| 70 | Wells Fargo & Company | Timothy Sloan | $18,426,734 | $6,465,081 | 7.64% | 283:1 | $65,191 |
| 71 | Kohl’s | Michelle Gass | $12,340,445 | $296,395 | 11.95% | 1,115:1 | $11,070 |
| 72 | Goldman Sachs Group (The) | David Solomon | $20,662,835 | $8,356,714 | 9.05% | 151:1 | $136,513 |
| 73 | Monster Beverage | Rodney Cyril Sacks | $13,914,931 | $405,750 | 35.63% | 251:1 | $55,370 |
| 74 | MGM Resorts International | James Joseph Murren | $12,849,021 | $772,754 | 13.51% | 355:1 | $36,192 |
| 75 | State Street | Joseph Hooley | $16,102,525 | $4,317,225 | 9.11% | 235:1 | $68,527 |
| 76 | Nucor | John Ferriola | $15,559,469 | $3,273,417 | 26.29% | 147:1 | $106,097 |
| 77 | Cigna | David Cordani | $18,944,045 | $6,208,580 | 6.99% | 298:1 | $63,526 |
| 78 | Merck & Company | Kenneth Frazier | $20,934,504 | $8,223,070 | 6.99% | 228:1 | $91,954 |
| 79 | Motorola Solutions | Gregory Brown | $20,348,558 | $6,785,627 | 7.47% | 211:1 | $96,553 |
| 80 | Honeywell International | Darius Adamczyk | $19,246,604 | $6,103,548 | 7.00% | 288:1 | $66,749 |
| 81 | Micron Technology | Sanjay Mehrotra | $14,241,583 | $2,106,932 | 10.04% | 252:1 | $56,540 |
| 82 | Fidelity National Information Services | Gary Norcross | $18,451,529 | $5,145,218 | 6.91% | 393:1 | $46,929 |
| 83 | Textron | Scott Donnelly | $13,948,917 | $1,542,146 | 44.06% | 143:1 | $97,580 |
| 84 | SL Green Realty | Marc Holliday | $13,355,778 | $1,691,415 | 16.47% | 194:1 | $68,880 |
| 85 | Symantec | Gregory Clark | $17,347,581 | $5,067,303 | 9.59% | 169:1 | $102,869 |
| 86 | AbbVie | Richard Gonzalez | $21,271,869 | $8,697,728 | 8.08% | 143:1 | $148,823 |
| 87 | UnitedParcel | David Abney | $15,060,876 | $2,926,275 | 8.50% | 272:1 | $55,417 |
| 88 | eBay | Devin Wenig | $18,172,166 | $5,277,452 | 10.35% | 152:1 | $119,562 |
| 89 | TechnipFMC | Douglas Pferdehirt | $13,403,500 | $286,633 | 30.45% | 225:1 | $59,634 |
| 90 | IQVIA Holdings | Ari Bousbib | $16,461,779 | $2,747,532 | 11.90% | 182:1 | $90,097 |
| 91 | ConocoPhillips | Ryan Lance | $23,406,270 | $11,791,763 | 7.48% | 143:1 | $163,817 |
| 92 | Citrix Systems | David Henshall | $19,258,102 | $6,275,717 | 10.98% | 113:1 | $170,433 |
| 93 | National Oilwell Varco | Clay Williams | $13,828,435 | $3,518,901 | 7.90% | 289:1 | $51,917 |
| 94 | PVH | Emanuel Chirico | $17,065,604 | $5,456,973 | 6.06% | 943:1 | $18,089 |
| 95 | Kroger Company (The) | W. Rodney McMullen | $12,037,872 | $214,335 | 10.42% | 483:1 | $24,912 |
| 96 | D.R. Horton | David Auld | $14,860,487 | $1,991,138 | 17.41% | 161:1 | $92,304 |
| 97 | Cummins | N. Thomas Linebarger | $17,291,978 | $5,018,017 | 7.34% | 281:1 | $61,576 |
| 98 | Adobe | Shantanu Narayen | $28,397,528 | $14,118,915 | 6.22% | 200:1 | $142,192 |
| 99 | Boeing (The) | Dennis Muilenburg | $23,392,187 | $9,540,003 | 6.84% | 184:1 | $126,991 |
| 100 | Macerich | Arthur Coppola | $12,873,426 | $1,563,103 | 29.04% | 148:1 | $86,698 |

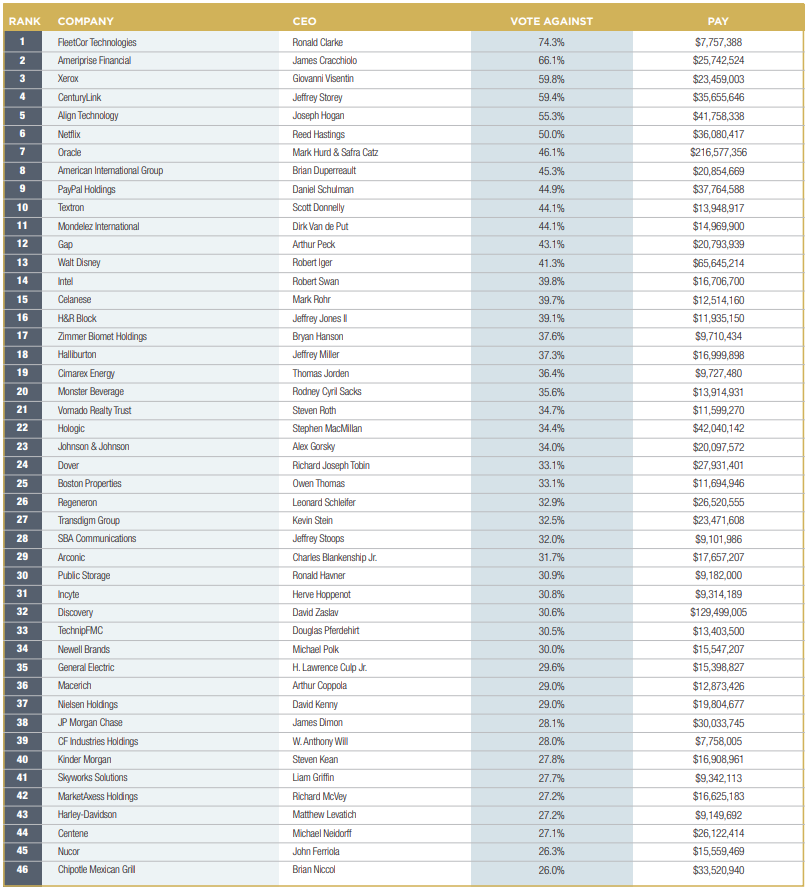
APPENDIX B – S&P 500 Companies With Most Shareholder Votes Against Ceo Pay
This table shows the 100 companies where the most shareholder votes were cast against the CEO pay package. Vote data from Morningstar Fund Votes database; Compensation data from ISS. These are ranked by level of opposition. The votes are not binding.
| RANK | COMPANY | CEO | VOTE AGAINST | PAY |
|---|---|---|---|---|
| 1 | FleetCor Technologies | Ronald Clarke | 74.3% | $7,757,388 |
| 2 | Ameriprise Financial | James Cracchiolo | 66.1% | $25,742,524 |
| 3 | Xerox | Giovanni Visentin | 59.8% | $23,459,003 |
| 4 | CenturyLink | Jeffrey Storey | 59.4% | $35,655,646 |
| 5 | Align Technology | Joseph Hogan | 55.3% | $41,758,338 |
| 6 | Netflix | Reed Hastings | 50.0% | $36,080,417 |
| 7 | Oracle | Mark Hurd & Safra Catz | 46.1% | $216,577,356 |
| 8 | American International Group | Brian Duperreault | 45.3% | $20,854,669 |
| 9 | PayPal Holdings | Daniel Schulman | 44.9% | $37,764,588 |
| 10 | Textron | Scott Donnelly | 44.1% | $13,948,917 |
| 11 | Mondelez International | Dirk Van de Put | 44.1% | $14,969,900 |
| 12 | Gap | Arthur Peck | 43.1% | $20,793,939 |
| 13 | Walt Disney | Robert Iger | 41.3% | $65,645,214 |
| 14 | Intel | Robert Swan | 39.8% | $16,706,700 |
| 15 | Celanese | Mark Rohr | 39.7% | $12,514,160 |
| 16 | H&R Block | Jeffrey Jones II | 39.1% | $11,935,150 |
| 17 | Zimmer Biomet Holdings | Bryan Hanson | 37.6% | $9,710,434 |
| 18 | Halliburton | Jeffrey Miller | 37.3% | $16,999,898 |
| 19 | Cimarex Energy | Thomas Jorden | 36.4% | $9,727,480 |
| 20 | Monster Beverage | Rodney Cyril Sacks | 35.6% | $13,914,931 |
| 21 | Vornado Realty Trust | Steven Roth | 34.7% | $11,599,270 |
| 22 | Hologic | Stephen MacMillan | 34.4% | $42,040,142 |
| 23 | Johnson & Johnson | Alex Gorsky | 34.0% | $20,097,572 |
| 24 | Dover | Richard Joseph Tobin | 33.1% | $27,931,401 |
| 25 | Boston Properties | Owen Thomas | 33.1% | $11,694,946 |
| 26 | Regeneron | Leonard Schleifer | 32.9% | $26,520,555 |
| 27 | Transdigm Group | Kevin Stein | 32.5% | $23,471,608 |
| 28 | SBA Communications | Jeffrey Stoops | 32.0% | $9,101,986 |
| 29 | Arconic | Charles Blankenship Jr. | 31.7% | $17,657,207 |
| 30 | Public Storage | Ronald Havner | 30.9% | $9,182,000 |
| 31 | Incyte | Herve Hoppenot | 30.8% | $9,314,189 |
| 32 | Discovery | David Zaslav | 30.6% | $129,499,005 |
| 33 | TechnipFMC | Douglas Pferdehirt | 30.5% | $13,403,500 |
| 34 | Newell Brands | Michael Polk | 30.0% | $15,547,207 |
| 35 | General Electric | H. Lawrence Culp Jr. | 29.6% | $15,398,827 |
| 36 | Macerich | Arthur Coppola | 29.0% | $12,873,426 |
| 37 | Nielsen Holdings | David Kenny | 29.0% | $19,804,677 |
| 38 | JP Morgan Chase | James Dimon | 28.1% | $30,033,745 |
| 39 | CF Industries Holdings | W. Anthony Will | 28.0% | $7,758,005 |
| 40 | Kinder Morgan | Steven Kean | 27.8% | $16,908,961 |
| 41 | Skyworks Solutions | Liam Griffin | 27.7% | $9,342,113 |
| 42 | MarketAxess Holdings | Richard McVey | 27.2% | $16,625,183 |
| 43 | Harley-Davidson | Matthew Levatich | 27.2% | $9,149,692 |
| 44 | Centene | Michael Neidorff | 27.1% | $26,122,414 |
| 45 | Nucor | John Ferriola | 26.3% | $15,559,469 |
| 46 | Chipotle Mexican Grill | Brian Niccol | 26.0% | $33,520,940 |
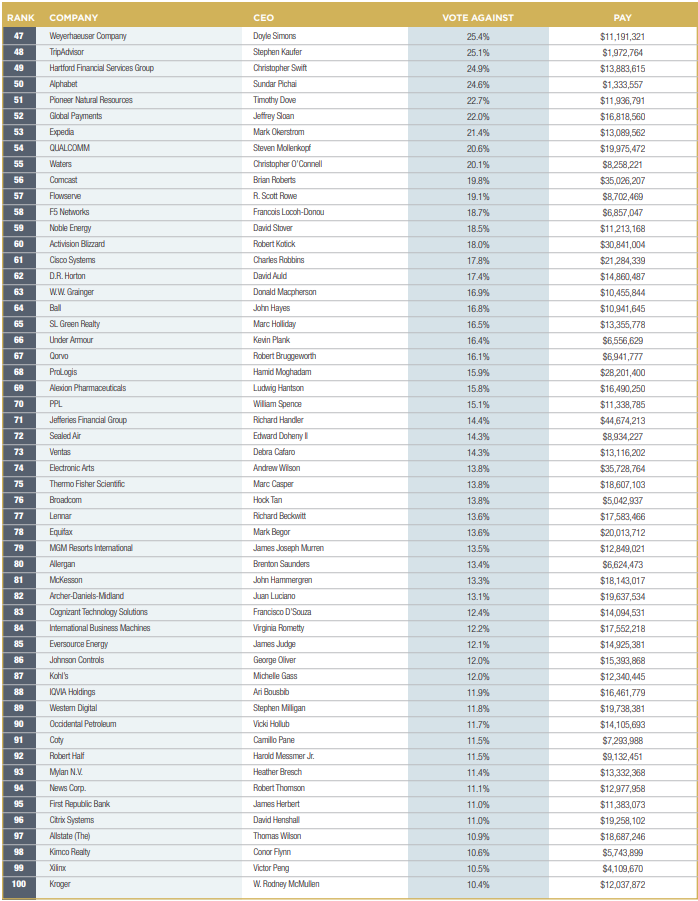
| 47 | Weyerhaeuser Company | Doyle Simons | 25.4% | $11,191,321 |
| 48 | TripAdvisor | Stephen Kaufer | 25.1% | $1,972,764 |
| 49 | Hartford Financial Services Group | Christopher Swift | 24.9% | $13,883,615 |
| 50 | Alphabet | Sundar Pichai | 24.6% | $1,333,557 |
| 51 | Pioneer Natural Resources | Timothy Dove | 22.7% | $11,936,791 |
| 52 | Global Payments | Jeffrey Sloan | 22.0% | $16,818,560 |
| 53 | Expedia | Mark Okerstrom | 21.4% | $13,089,562 |
| 54 | QUALCOMM | Steven Mollenkopf | 20.6% | $19,975,472 |
| 55 | Waters | Christopher O’Connell | 20.1% | $8,258,221 |
| 56 | Comcast | Brian Roberts | 19.8% | $35,026,207 |
| 57 | Flowserve | R. Scott Rowe | 19.1% | $8,702,469 |
| 58 | F5 Networks | Francois Locoh-Donou | 18.7% | $6,857,047 |
| 59 | Noble Energy | David Stover | 18.5% | $11,213,168 |
| 60 | Activision Blizzard | Robert Kotick | 18.0% | $30,841,004 |
| 61 | Cisco Systems | Charles Robbins | 17.8% | $21,284,339 |
| 62 | D.R. Horton | David Auld | 17.4% | $14,860,487 |
| 63 | W.W. Grainger | Donald Macpherson | 16.9% | $10,455,844 |
| 64 | Ball | John Hayes | 16.8% | $10,941,645 |
| 65 | SL Green Realty | Marc Holliday | 16.5% | $13,355,778 |
| 66 | Under Armour | Kevin Plank | 16.4% | $6,556,629 |
| 67 | Qorvo | Robert Bruggeworth | 16.1% | $6,941,777 |
| 68 | ProLogis | Hamid Moghadam | 15.9% | $28,201,400 |
| 69 | Alexion Pharmaceuticals | Ludwig Hantson | 15.8% | $16,490,250 |
| 70 | PPL | William Spence | 15.1% | $11,338,785 |
| 71 | Jefferies Financial Group | Richard Handler | 14.4% | $44,674,213 |
| 72 | Sealed Air | Edward Doheny II | 14.3% | $8,934,227 |
| 73 | Ventas | Debra Cafaro | 14.3% | $13,116,202 |
| 74 | Electronic Arts | Andrew Wilson | 13.8% | $35,728,764 |
| 75 | Thermo Fisher Scientific | Marc Casper | 13.8% | $18,607,103 |
| 76 | Broadcom | Hock Tan | 13.8% | $5,042,937 |
| 77 | Lennar | Richard Beckwitt | 13.6% | $17,583,466 |
| 78 | Equifax | Mark Begor | 13.6% | $20,013,712 |
| 79 | MGM Resorts International | James Joseph Murren | 13.5% | $12,849,021 |
| 80 | Allergan | Brenton Saunders | 13.4% | $6,624,473 |
| 81 | McKesson | John Hammergren | 13.3% | $18,143,017 |
| 82 | Archer-Daniels-Midland | Juan Luciano | 13.1% | $19,637,534 |
| 83 | Cognizant Technology Solutions | Francisco D’Souza | 12.4% | $14,094,531 |
| 84 | International Business Machines | Virginia Rometty | 12.2% | $17,552,218 |
| 85 | Eversource Energy | James Judge | 12.1% | $14,925,381 |
| 86 | Johnson Controls | George Oliver | 12.0% | $15,393,868 |
| 87 | Kohl’s | Michelle Gass | 12.0% | $12,340,445 |
| 88 | IQVIA Holdings | Ari Bousbib | 11.9% | $16,461,779 |
| 89 | Western Digital | Stephen Milligan | 11.8% | $19,738,381 |
| 90 | Occidental Petroleum | Vicki Hollub | 11.7% | $14,105,693 |
| 91 | Coty | Camillo Pane | 11.5% | $7,293,988 |
| 92 | Robert Half | Harold Messmer Jr. | 11.5% | $9,132,451 |
| 93 | Mylan N.V. | Heather Bresch | 11.4% | $13,332,368 |
| 94 | News Corp. | Robert Thomson | 11.1% | $12,977,958 |
| 95 | First Republic Bank | James Herbert | 11.0% | $11,383,073 |
| 96 | Citrix Systems | David Henshall | 11.0% | $19,258,102 |
| 97 | Allstate (The) | Thomas Wilson | 10.9% | $18,687,246 |
| 98 | Kimco Realty | Conor Flynn | 10.6% | $5,743,899 |
| 99 | Xilinx | Victor Peng | 10.5% | $4,109,670 |
| 100 | Kroger | W. Rodney McMullen | 10.4% | $12,037,872 |
This table lists Overpaid CEOs, as calculated by the HIP Investor regression analysis, seeking to link CEO pay amounts to company financial performance.
Although we, like many other analysts, find very weak links between pay amounts and company financial performance, the usual justification for high executive pay is that higher pay is intended to be connected to higher profits and above-average capital appreciation for the shareholders who foot the bill of excess pay. If we grant the assumption that pay should be determined by performance, and then use a basic statistical technique to map actual performance outcomes to predicted levels of pay relative to those outcomes, we can then see how much the CEO pay package exceeded such a prediction. Those with highest excess are ranked in the table below – and constitute this list of Overpaid CEOs of the S&P 500.
Executive pay data series included:
Raw data: Simply looking at every ISS-identified executive’s pay package, in each year, as a single data point value – including pay, bonus, stock grants and stock options – to be paired with financial performance for that year.
The series is supplemented using a Thomson Reuters Asset4 data set that captures the single largest pay package for each (company, year) pair. If ISS did not report a CEO for a given pair, and that pair was available in the Asset4 series, the Asset4 data were included. Where ISS identifies multiple co-CEOs who split the job (like Oracle), their pay packages are added together. Once the full set of pay packages is assembled, each (company, year) value is paired with the performance for that year, and this full set is used for the regression.
Each type of executive pay could be reported in any year analyzed from 2007-2019, though not every company was reported for every year.
Financial performance series factors included:
Return on invested capital (ROIC – cash flow available to pay both debt and equity capital owners, adjusted for tax effects, divided by the total value of that capital). ROIC is sourced from Thomson Reuters WorldScope, which sources data from companies’ annual reports and investor filings.
Total return (capital gains and dividends) on the company’s primary equity. This is calculated from the Thomson Reuters DataStream Return Index series, using trailing periods behind June 30 of the year of the pay package as identified by ISS (or matching the year for the supplementary largest package data from Asset4). Both performance factors were calculated across one-year, three-year, and five-year windows, trailing behind each possible pay year. Thus, data was considered as far back as 2002 (for the five-year window trailing pay data from 2007).
| RANK | COMPANY | EXPECTED CEO PAY BASED ON-PERFORMANCE | ACTUAL CEO PAY | AMOUNT OF OVERPAY | EXCESS PAY |
|---|---|---|---|---|---|
| 1 | Oracle | $12,535,752 | $216,577,356 | $204,041,604 | 1627.7% |
| 2 | Discovery | $11,594,508 | $129,499,005 | $117,904,497 | 1016.9% |
| 3 | Tmobile | $13,156,752 | $66,538,206 | $53,381,454 | 405.7% |
| 4 | Walt Disney | $12,766,160 | $65,645,214 | $52,879,054 | 414.2% |
| 5 | Estee Lauder | $13,461,235 | $48,753,819 | $35,292,584 | 262.2% |
| 6 | Jefferies Financial Group | $11,563,376 | $44,674,213 | $33,110,837 | 286.3% |
| 7 | Salesforce.com | $13,453,038 | $45,353,002 | $31,899,964 | 237.1% |
| 8 | Hologic | $12,899,287 | $42,040,142 | $29,140,855 | 225.9% |
| 9 | Align Technology | $14,638,545 | $41,758,338 | $27,119,793 | 185.3% |
| 10 | CenturyLink | $10,962,958 | $35,655,646 | $24,692,688 | 225.2% |
| 11 | PayPal Holdings | $14,652,880 | $37,764,588 | $23,111,708 | 157.7% |
| 12 | Comcast | $12,736,444 | $35,026,207 | $22,289,763 | 175.0% |
| 13 | Electronic Arts | $13,591,982 | $35,728,764 | $22,136,782 | 162.9% |
| 14 | Chipotle Mexican Grill | $12,217,849 | $33,520,940 | $21,303,091 | 174.4% |
| 15 | Netflix | $15,003,920 | $36,080,417 | $21,076,497 | 140.5% |
| 16 | DaVita | $11,539,517 | $32,017,501 | $20,477,984 | 177.5% |
| 17 | DXC Technology Co | $13,404,197 | $32,185,309 | $18,781,112 | 140.1% |
| 18 | Activision Blizzard | $13,150,612 | $30,841,004 | $17,690,392 | 134.5% |
| 19 | Kraft Heinz | $10,436,471 | $27,692,849 | $17,256,378 | 165.3% |
| 20 | AT&T | $12,225,230 | $29,118,118 | $16,892,888 | 138.2% |
| 21 | JP Morgan Chase | $13,160,470 | $30,033,745 | $16,873,275 | 128.2% |
| 22 | CBS | $11,671,057 | $27,359,452 | $15,688,395 | 134.4% |
| 23 | Morgan Stanley | $12,515,975 | $28,168,639 | $15,652,664 | 125.1% |
| 24 | Dover | $12,547,726 | $27,931,401 | $15,383,675 | 122.6% |
| 25 | ProLogis | $13,224,457 | $28,201,400 | $14,976,943 | 113.3% |
| 26 | Caterpillar | $12,481,530 | $27,289,513 | $14,807,983 | 118.6% |
| 27 | Regeneron | $12,051,225 | $26,520,555 | $14,469,330 | 120.1% |
| 28 | Gilead Sciences | $11,766,483 | $25,961,831 | $14,195,348 | 120.6% |
| 29 | Adobe | $14,278,613 | $28,397,528 | $14,118,915 | 98.9% |
| 30 | BlackRock | $12,685,926 | $26,543,344 | $13,857,418 | 109.2% |
| 31 | Ameriprise Financial | $12,377,300 | $25,742,524 | $13,365,224 | 108.0% |
| 32 | Centene | $13,560,578 | $26,122,414 | $12,561,836 | 92.6% |
| 33 | Ralph Lauren | $11,541,602 | $23,792,036 | $12,250,434 | 106.1% |
| 34 | Microsoft | $14,041,266 | $25,843,263 | $11,801,997 | 84.1% |
| 35 | ConocoPhillips | $11,614,507 | $23,406,270 | $11,791,763 | 101.5% |
| 36 | Omnicom Group | $12,329,996 | $23,945,128 | $11,615,132 | 94.2% |
| 37 | Citigroup | $12,604,662 | $24,183,714 | $11,579,052 | 91.9% |
| 38 | Xerox | $12,248,014 | $23,459,003 | $11,210,989 | 91.5% |
| 39 | Abbott Laboratories | $13,219,250 | $24,254,238 | $11,034,988 | 83.5% |
| 40 | Walmart | $12,693,910 | $23,618,233 | $10,924,323 | 86.1% |
| 41 | Northrop Grumman | $13,663,012 | $24,185,259 | $10,522,247 | 77.0% |
| 42 | CVS Health | $11,590,072 | $21,939,098 | $10,349,026 | 89.3% |
| 43 | International Paper Company | $11,968,423 | $21,911,137 | $9,942,714 | 83.1% |
| 44 | Norwegian Cruise Line Holdings | $12,712,929 | $22,593,061 | $9,880,132 | 77.7% |
| 45 | Gap (The) | $10,969,016 | $20,793,939 | $9,824,923 | 89.6% |
| 46 | Bank of America | $13,023,461 | $22,754,510 | $9,731,049 | 74.7% |
| 47 | Verizon Communications | $12,483,952 | $22,206,086 | $9,722,134 | 77.9% |
| 48 | General Motors | $12,301,746 | $21,870,450 | $9,568,704 | 77.8% |
| 49 | Boeing | $13,852,184 | $23,392,187 | $9,540,003 | 68.9% |
| 50 | Transdigm Group | $13,948,553 | $23,471,608 | $9,523,055 | 68.3% |
| 51 | Raytheon Company | $13,059,537 | $22,420,258 | $9,360,721 | 71.7% |
| 52 | Viacom | $10,650,579 | $19,955,161 | $9,304,582 | 87.4% |
| 53 | $13,620,661 | $22,554,543 | $8,933,882 | 65.6% | |
| 54 | Accenture | $13,394,849 | $22,299,174 | $8,904,325 | 66.5% |
| 55 | American International Group | $12,012,635 | $20,854,669 | $8,842,034 | 73.6% |
| 56 | Nielsen Holdings | $11,081,566 | $19,804,677 | $8,723,111 | 78.7% |
| 57 | AbbVie | $12,574,141 | $21,271,869 | $8,697,728 | 69.2% |
| 58 | Western Digital | $11,184,176 | $19,738,381 | $8,554,205 | 76.5% |
| 59 | Chevron | $12,127,949 | $20,640,623 | $8,512,674 | 70.2% |
| 60 | Goldman Sachs Group | $12,306,121 | $20,662,835 | $8,356,714 | 67.9% |
| 61 | Merck & Company | $12,711,434 | $20,934,504 | $8,223,070 | 64.7% |
| 62 | Nextera Energy | $13,230,972 | $21,358,742 | $8,127,770 | 61.4% |
| 63 | HCA Healthcare | $13,333,384 | $21,419,906 | $8,086,522 | 60.6% |
| 64 | Lockheed Martin | $13,442,075 | $21,516,613 | $8,074,538 | 60.1% |
| 65 | General Dynamics | $12,739,572 | $20,720,254 | $7,980,682 | 62.6% |
| 66 | Booking Holdings | $12,579,987 | $20,459,184 | $7,879,197 | 62.6% |
| 67 | QUALCOMM | $12,099,498 | $19,975,472 | $7,875,974 | 65.1% |
| 68 | Cisco Systems | $13,432,544 | $21,284,339 | $7,851,795 | 58.5% |
| 69 | Chubb | $12,618,300 | $20,357,484 | $7,739,184 | 61.3% |
| 70 | Archer-Daniels-Midland | $11,993,139 | $19,637,534 | $7,644,395 | 63.7% |
| 71 | Johnson & Johnson | $12,545,623 | $20,097,572 | $7,551,949 | 60.2% |
| 72 | Bristol-Myers Squibb | $11,995,755 | $19,379,755 | $7,384,000 | 61.6% |
| 73 | Marathon Petroleum | $12,669,854 | $19,806,050 | $7,136,196 | 56.3% |
| 74 | Intuit | $13,944,483 | $21,071,738 | $7,127,255 | 51.1% |
| 75 | Equifax | $12,974,518 | $20,013,712 | $7,039,194 | 54.3% |
| 76 | Exxon Mobil | $11,768,719 | $18,777,787 | $7,009,068 | 59.6% |
| 77 | Phillips 66 | $12,356,334 | $19,278,335 | $6,922,001 | 56.0% |
| 78 | Motorola Solutions | $13,562,931 | $20,348,558 | $6,785,627 | 50.0% |
| 79 | Pfizer | $12,763,673 | $19,549,213 | $6,785,540 | 53.2% |
| 80 | Hilton Worldwide Holdings | $13,042,694 | $19,790,569 | $6,747,875 | 51.7% |
| 81 | McKesson | $11,489,880 | $18,143,017 | $6,653,137 | 57.9% |
| 82 | HP | $12,588,788 | $19,215,534 | $6,626,746 | 52.6% |
| 83 | Halliburton | $10,509,758 | $16,999,898 | $6,490,140 | 61.8% |
| 84 | Wells Fargo & Company | $11,961,653 | $18,426,734 | $6,465,081 | 54.0% |
| 85 | Citrix Systems | $12,982,385 | $19,258,102 | $6,275,717 | 48.3% |
| 86 | Mastercard | $14,107,121 | $20,379,353 | $6,272,232 | 44.5% |
| 87 | DuPont de Nemours | $12,457,560 | $18,675,302 | $6,217,742 | 49.9% |
| 88 | LyondellBasell Industries | $11,996,069 | $18,206,797 | $6,210,728 | 51.8% |
| 89 | Cigna | $12,735,465 | $18,944,045 | $6,208,580 | 48.8% |
| 90 | Ford Motor Company | $11,552,911 | $17,752,835 | $6,199,924 | 53.7% |
| 91 | United Technologies | $12,255,972 | $18,418,315 | $6,162,343 | 50.3% |
| 92 | Honeywell International | $13,143,056 | $19,246,604 | $6,103,548 | 46.4% |
| 93 | Arconic | $11,602,417 | $17,657,207 | $6,054,790 | 52.2% |
| 94 | Westrock | $12,053,000 | $18,030,504 | $5,977,504 | 49.6% |
| 95 | Freeport-McMoran | $10,474,588 | $16,424,035 | $5,949,447 | 56.8% |
| 96 | Vertex Pharmaceuticals | $12,936,435 | $18,799,147 | $5,862,712 | 45.3% |
| 97 | Wynn Resorts | $11,340,665 | $17,129,183 | $5,788,518 | 51.0% |
| 98 | Allstate | $12,905,137 | $18,687,246 | $5,782,109 | 44.8% |
| 99 | International Business Machines (IBM) | $11,775,191 | $17,552,218 | $5,777,027 | 49.1% |
| 100 | Amgen | $12,784,350 | $18,555,266 | $5,770,916 | 45.1% |
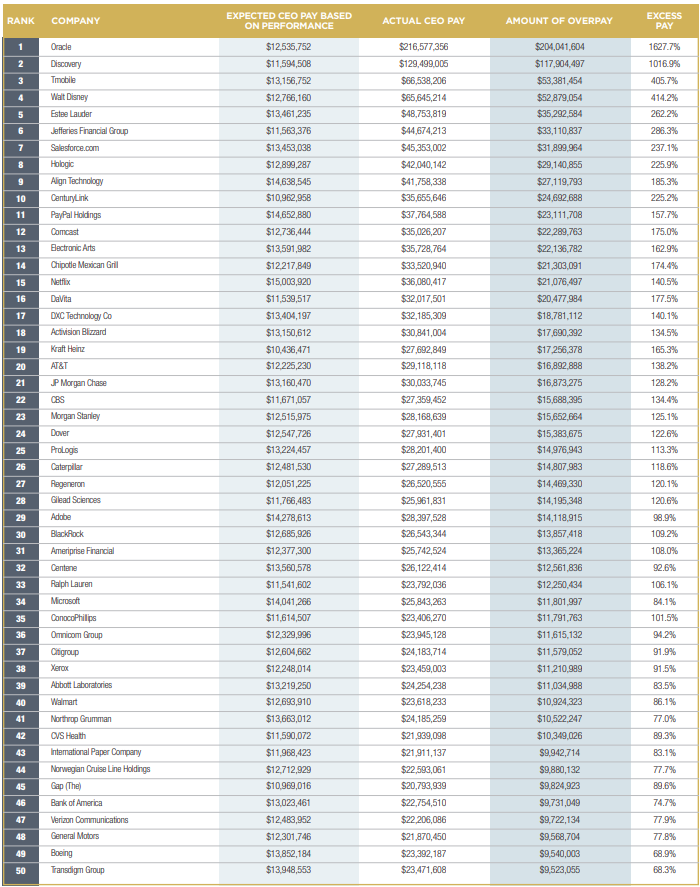
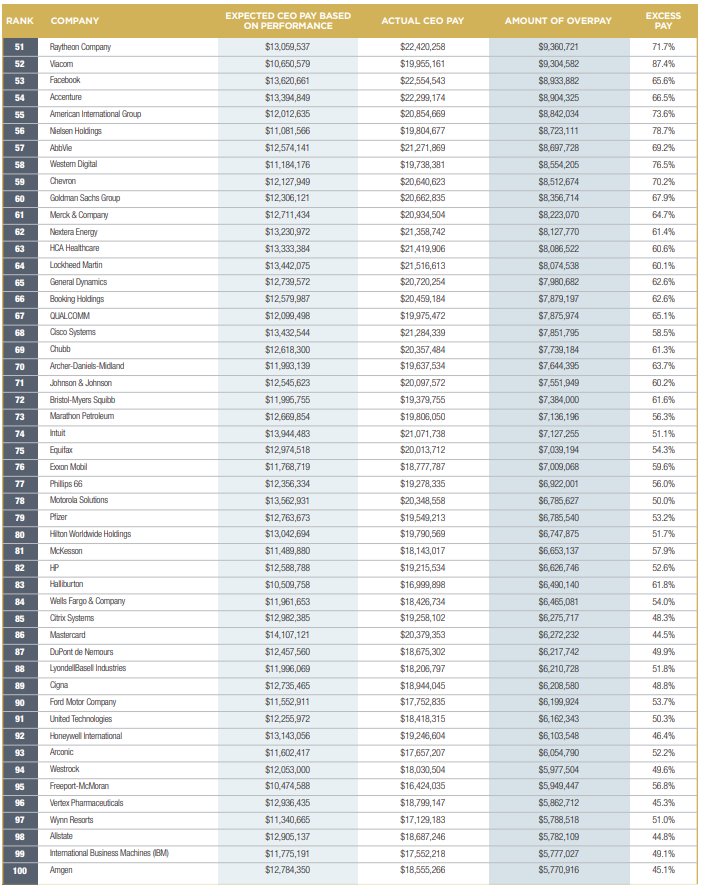
This table summarizes more than 100 financial fund managers on their CEO pay votes at all S&P 500 companies and the 100 companies with the most overpaid CEOs.
| FINANCIAL MANAGER | AUM IN BILLIONS | VOTES AGAINST S&P 500 | VOTES AGAINST TOP 100 |
|---|---|---|---|
| Aberdeen Standard Investments | 643 | 75% | 81% |
| Achmea | 104 | 76% | 83% |
| AEGON Investment Management | 1 | 14% | 37% |
| AllianceBernstein | 487 | 11% | 32% |
| Allianz Global Investors | 596 | 86% | 93% |
| ALPS Advisors | 17 | 11% | 33% |
| American Beacon Advisors | 52 | 3% | 5% |
| American Century | 159 | 11% | 33% |
| Amplify Investments | 1 | 23% | 27% |
| AQR Capital Management | 270 | 11% | 33% |
| Artisan Partners | 96 | 15% | 28% |
| Aviva Investors | 440 | 75% | 84% |
| AXA Investment Managers | 821 | 34% | 52% |
| Azzad Asset Management | 0.7 | 71% | 89% |
| Barings | 317 | 10% | 34% |
| BlackRock | 7,430 | 3% | 8% |
| BMO Global Asset Management | 263 | 71% | 74% |
| BNP Paribas Asset Management | 478 | 75% | 91% |
| BNY Mellon | 1,800 | 28% | 49% |
| Boston Common Asset Management | 2 | 20% | 47% |
| Bridgeway Capital Management | 9 | 11% | 27% |
| Brown Advisory | 48 | 17% | 36% |
| Calamos Advisors | 21 | 0% | 0% |
| Calvert Research and Management | 15 | 51% | 77% |
| Candriam | 128 | 8% | 13% |
| Capital Group | 1,600 | 8% | 27% |
| Cavanal Hill Investment Management | 7 | 0% | 0% |
| Charles Schwab Investment Management | 379 | 6% | 20% |
| CI Investments | 131 | 6% | 23% |
| CIBC Global Asset Management | 101 | 11% | 32% |
| ClearBridge Investments | 142 | 6% | 18% |
| Cohen & Steers Capital Management | 54 | 4% | 7% |
| Columbia Threadneedle U.S. | 459 | 11% | 34% |
| Commerce Bank (Kansas City) | 3 | 9% | 24% |
| Delaware Management Company (Macquarie) | 257 | 11% | 25% |
| Dimensional Fund Advisors (DFA) | 569 | 17% | 48% |
| Domini lmpact Investments | 2 | 68% | 98% |
| DWS Investment Management Americas | 178 | 14% | 34% |
| Eagle Asset Management | 33 | 0% | 0% |
| Eaton Vance Management | 103 | 10% | 28% |
| Everence Capital Management | 1 | 20% | 41% |
| Exchange Traded Concepts | 4 | 11% | 31% |
| Federated Investment Management | 217 | 7% | 25% |
| Fidelity International | 401 | 20% | 23% |
| Fidelity Management & Research Co. (FMR) | 2,530 | 6% | 17% |
| First Trust Advisors | 113 | 12% | 34% |
| Franklin Templeton Investments | 717 | 7% | 20% |
| Fred Alger Management | 22 | 14% | 27% |
| GAM | 135 | 11% | 34% |
| Geode Capital Management | 368 | 10% | 30% |
| Glenmede Investment Management | 15 | 11% | 29% |
| Goldman Sachs Asset Management | 1,600 | 11% | 31% |
| Gotham Asset Management | 9 | 11% | 33% |
| Green Century Capital Management | 1 | 81% | 77% |
| Guggenheim Investments | 3 | 11% | 34% |
| Harbor Capital Advisors | 48 | 7% | 13% |
| Harris Associates | 115 | 0% | 0% |
| Hartford Investment Management | 94 | 14% | 35% |
| Hennessy Advisors | 5 | 0% | 0% |
| Highland Capital Management Fund Advisors | 3 | 13% | 35% |
| Horizon Investments | 4 | 0% | 0% |
| HSBC Global Asset Management | 455 | 53% | 58% |
| ICON Advisers | 1 | 9% | 21% |
| Impax Asset Management | 16 | 36% | 76% |
| Invesco Advisers | 658 | 7% | 24% |
| Investec Asset Management | 106 | 4% | 6% |
| Investors Group | 118 | 8% | 24% |
| Ivy Investment Management | 68 | 1% | 0% |
| Jackson Square Partners | 17 | 10% | 20% |
| Janus Henderson Investors (U.S.) | 168 | 9% | 23% |
| Jennison Associates | 161 | 10% | 30% |
| JPMorgan Investment Management | 2,100 | 6% | 17% |
| Lazard Asset Management | 240 | 12% | 30% |
| Legal & General Investment Management | 1,306 | 54% | 65% |
| Loomis, Sayles | 264 | 6% | 14% |
| Lord Abbett | 208 | 3% | 8% |
| LSV Asset Management | 106 | 9% | 27% |
| M&G Investment Management | 293 | 5% | 12% |
| MacKay Shields | 108 | 11% | 32% |
| Macquarie Investment Management (Australia) | 231 | 11% | 33% |
| Manulife Asset Management | 182 | 11% | 32% |
| Meeder Asset Management | 3 | 11% | 31% |
| MetLife Advisers | 461 | 11% | 33% |
| MFS Investment Management | 333 | 7% | 23% |
| Morgan Stanley Investment Management | 463 | 18% | 42% |
| Mutual of America Capital Management | 17 | 11% | 33% |
| Nationwide Fund Advisors | 71 | 11% | 32% |
| Natixis Global Asset Management | 923 | 10% | 39% |
| Neuberger Berman | 242 | 8% | 25% |
| New Covenant Funds | 1 | 11% | 33% |
| Nordea Investment Management | 283 | 95% | 97% |
| Northern Trust Investments | 956 | 3% | 11% |
| Nuveen Asset Management | 176 | 12% | 35% |
| Ohio National Investments | 9.1 | 0 | 0 |
| Olstein Capital Management | 1 | 9% | 33% |
| OppenheimerFunds | 1 | 10% | 24% |
| Pacer Advisors | 3 | 11% | 32% |
| Pacific Investment Management Co. (PIMCO) | 1,760 | 13% | 26% |
| Parametric Portfolio Associates | 266 | 25% | 52% |
| Parnassus Investments | 24 | 3% | 12% |
| Penn Mutual Asset Management | 20 | 6% | 18% |
| Pictet Asset Management Limited | 179 | 7% | 22% |
| PNC Capital Advisors | 24 | 10% | 31% |
| PRIMECAP Management | 127 | 3% | 3% |
| Principal Global Investors | 296 | 11% | 33% |
| ProFund Advisors | 4 | 12% | 34% |
| ProShares | 32 | 12% | 34% |
| Putnam Investment Management | 89 | 7% | 18% |
| Quantitative Management Associates | 122 | 17% | 41% |
| RBC Global Asset Management | 350 | 16% | 40% |
| Reynolds Capital Management | ????? | 0 | 0 |
| Robeco/RobecoSAM | 208 | 50% | 83% |
| Royal London Asset Management | 156 | 71% | 95% |
| Russell Investment Management | 293 | 15% | 41% |
| Sarasin & Partners | 17 | 92% | 94% |
| Saturna Capital | 4 | 14% | 0% |
| Schroders | 537 | 39% | 46% |
| SIT Investment Associates | 3 | 12% | 32% |
| State Farm Insurance Co. Asset Management | 7 | 0% | 0% |
| State Street | 2,810 | 5% | 15% |
| Sterling Capital Management | 57 | 10% | 27% |
| Stone Ridge Asset Management | 16 | 10% | 31% |
| SunAmerica Asset Management | 69 | 12% | 34% |
| Swedbank Robur | 154 | 96% | 100% |
| Swisscanto | 160 | 30% | 49% |
| T. Rowe Price Associates | 1,110 | 6% | 20% |
| TCW Asset Management | 43 | 7% | 13% |
| TD Asset Management | 367 | 11% | 30% |
| The Dreyfus Corporation | 200 | 27% | 48% |
| Thrivent Investment Management | 11 | 10% | 29% |
| TIAA-CREF Asset Management | 208 | 6% | 17% |
| TIFF Advisory Services | 6 | 13% | 29% |
| Tocqueville Asset Management | 11 | 14% | 55% |
| Trillium Asset Management | 3 | 99.6% | 100% |
| UBS Asset Management | 831 | 65% | 76% |
| Union Investment | 384 | 58% | 61% |
| United Services Automobile Association (USAA) | 155 | 11% | 33% |
| Vanguard | 4,530 | 4% | 10% |
| Victory Capital Management | 146 | 11% | 34% |
| Virtus Investment Partners | 27 | 0% | 0% |
| Voya Investment Management | 213 | 4% | 14% |
| Walden Asset Management | 7 | 15% | 53% |
| Wellington Management Company | 1,182 | 6% | 14% |
| Wells Fargo Funds Management | 433 | 11% | 31% |
| Wilmington Trust Investment Management | 2 | 11% | 34% |
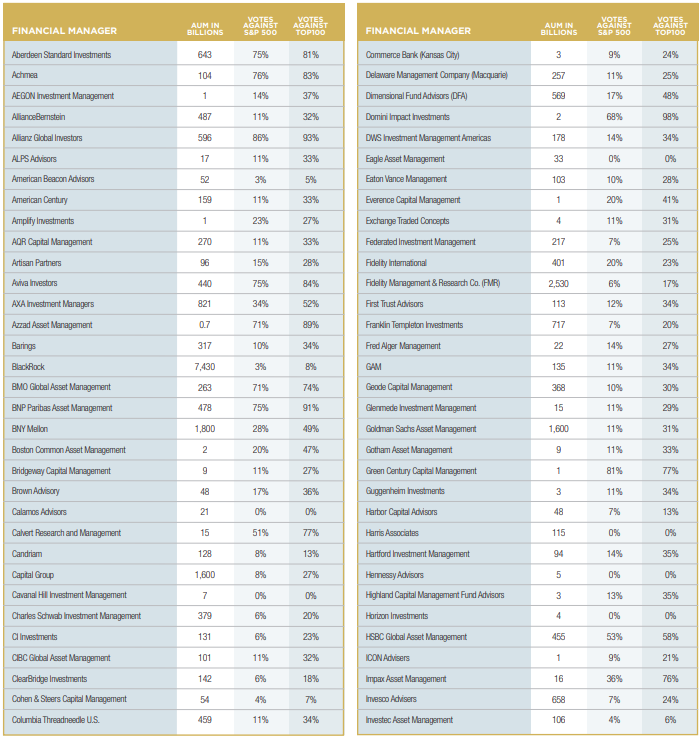
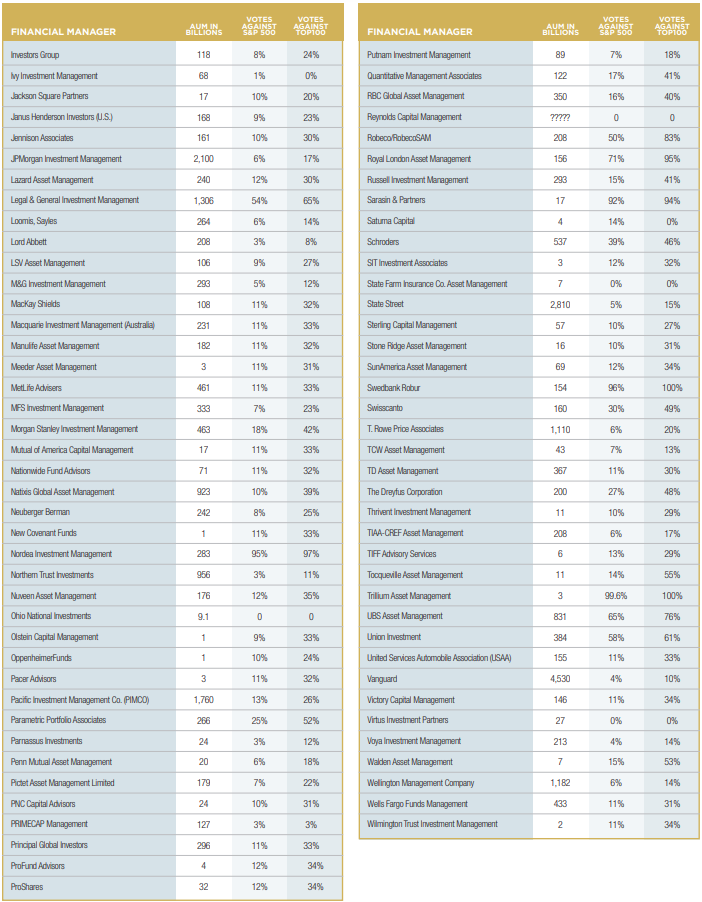
Data provided by Proxy Insight.
| FUND NAME | AUM IN BILLIONS | VOTES AGAINST S&P 500 | VOTES AGAINST TOP 100 |
|---|---|---|---|
| Alaska Retirement Management Board | 26 | 11% | 32% |
| Alberta Investment Management Corporation (AIMco) | 78 | 15% | 33% |
| APG (Dutch pension fund) | 531 | 68% | 84% |
| Arizona State Retirement System | 41 | 11% | 34% |
| ASR Nederland | 67 | 11% | 35% |
| ATP (Denmark pension fund) | 119 | 69% | 95% |
| British Columbia Inv. Mgmt (BCI) | 146 | 33% | 63% |
| Caisse de dépôt et placement du Québec | 246 | 18% | 38% |
| California PERS | 396 | 50% | 77% |
| California STRS | 254 | 13% | 43% |
| Canada Pension Plan Inv Board (CPPIB) | 410 | 15% | 44% |
| Colorado PERA | 55 | 11% | 33% |
| Employees’ Retirement System of Georgia (ERS) | 17 | 0% | 0% |
| First State Super | 53 | 11% | 30% |
| Florida State Board of Administration | 206 | 64% | 89% |
| Illinois Municipal Retirement Fund | 39 | 10% | 30% |
| Illinois State Board of Investment | 23 | 18% | 42% |
| Kentucky Teachers’ Retirement System | 20 | 9% | 27% |
| Korea National Pension Service | 610 | 25% | 20% |
| LA County Employees Retirement Association (LACERA) | 59 | 28% | 63% |
| Los Angeles City Employees Retirement System (LACERS) | 17 | 11% | 31% |
| Maine Public Employees Retirement System | 14 | 11% | 33% |
| Maryland State Retirement and Pension System | 55 | 12% | 34% |
| Massachusetts Pension Reserves Inv Mgmt (PRIM) | 73 | 27% | 54% |
| Minnesota State Board of Investment | 96 | 73% | 92% |
| MN (Dutch pension fund) | 146 | 99% | 100% |
| New Hampshire Retirement System | 8 | 11% | 33% |
| New Jersey State Treasury | 80 | 11% | 33% |
| New York City Pension Funds | 216 | 19% | 51% |
| Norges (Norway) Bank Inv Mgmt | 1,143 | 7% | 21% |
| North Carolina Department of State Treasurer | 94 | 13% | 44% |
| NY State Teachers’ Retirement System | 120 | 11% | 35% |
| Ohio Public Employees Retirement System (OPERS) | 92 | 22% | 51% |
| Ohio School Employees Retirement System (SERS) | 14 | 22% | 45% |
| Ontario Municipal ERS | 97 | 8% | 27% |
| Ontario Teachers’ Pension Plan (OTPP) | 190 | 23% | 48% |
| Oregon Investment Council | 103 | 21% | 43% |
| Pennsylvania Public School ERS | 54 | 10% | 50% |
| Pennsylvania State Employees’ Retirement System (SERS) | 27 | 10% | 31% |
| Pensioenfonds Metaal en Techniek (Dutch) | 81 | 99% | 98% |
| Pensionfund Metalektro (PME) (Dutch) | 53 | 99% | 100% |
| PGGM Investments (Dutch pension fund admin.) | 238 | 98% | 99% |
| PSP Investments (Canadian) | 127 | 14% | 39% |
| State of Connecticut Retirement Plans & Trust Funds | 34 | 18% | 40% |
| State of Rhode Island | 8 | 41% | 55% |
| State of Wisconsin Investment Board (SWIB) | 111 | 12% | 34% |
| State Teachers’ Retirement System of Ohio | 80 | 11% | 34% |
| SunSuper | 42 | 3% | 9% |
| Teacher Retirement System of Texas | 177 | 12% | 34% |
| Texas Education Agency | 47 | 10% | 30% |
| The NY State Common Retirement Fund | 211 | 26% | 57% |
| University of California | 119 | 15% | 34% |
| Vermont Pension Investment Committee | 4 | 26% | 51% |
| Virginia Retirement System | 87 | 11% | 30% |
| Washington State Investment Board (WSIB) | 135 | 12% | 36% |

By HIP Investor (Onindo Khan, Erik Nielsen and R. Paul Herman)
FIGURE 1: OVERPAID CEOS UNDERPERFORM FINANCIALLY
Total Shareholder Return (TSR), annualized 3 years and 4.84 years
(2012-15; Feb 2015- EOY 19)
Figure 1 - Overpaid CEOs Underperform Financially
The S&P 500 companies continue to boost CEO pay, the average CEO now gets almost 300 times the median worker’s pay, and the average Overpaid CEOs get 460 times the average worker pay – and the most overpaid CEO collects more than 3,000 times the median worker pay. While defenders of high CEO pay contend that the rewards are for increased shareholder value, our analysis show that this is far from clear. Shareholders of companies with the most overpaid CEOs have varying performances, while the average underperforms the S&P 500.
The first edition of As You Sow’s Most Overpaid CEOs report, published in 2015, identified the 100 firms significantly overpaying their chief executives. Advocates of high CEO pay contend that pay was high at these companies as a reward for high shareholder returns. However, as seen in Figure 1, the average annual total shareholder returns in the three years prior (2/28/2012 to 2/28/2015) to a high pay package was essentially the same as it was at companies without the same levels of excess pay. Then, in the nearly five years since (2/28/2015 to 12/31/2019), the group of companies with the most overpaid CEOs underperformed the S&P 500 dramatically. If savvy investors sold, shorted or underweighted the 100 most overpaid firms, they would have earned more than the stock market average.
When we look at the quantitative evidence, pay for performance is a myth.
FIGURE 2: MOST QUARTILES AND DECILE OF OVERPAID CEOS LAG THE MARKET Total Shareholder Return (TSR), annualized 3 years and 4.84 years
Figure 2 - Most Quartiles and Decile of Overpaid CEOs Lag the Market
(2012-2015; Feb 2015- EOY 19)
Our HIP Investor team analyzed multiple financial indicators over different timeframes for all S&P 500 companies and consistently found extremely low correlations (single digit correlation coefficients) between CEO pay and historical financial performance – whether one-, three- or five-year performance for financial ratios including Return on Invested Capital (ROIC), and Total Shareholder Return (TSR) including capital gains and reinvested dividends.
Unbundling the most overpaid 100 into the worst decile of 10 firms, the remainder of the worst quartile, and the remaining three quartiles, all segments underperformed the S&P500 market average. Again, this year, the worst 10 firms with the highest overpaid CEOs eroded shareholder value, losing money for investors and dramatically lagging the market.
Figure 3 - 2019 Overpaid CEOs Posting Fewer Gains Than Their Peers
FIGURE 3: 2019 OVERPAID CEOS POSTING FEWER GAINS THAN THEIR PEERS
1-Year Total shareholder Return (TSR)
from 12/31/18 to 12/31/19 of the 2019 Overpaid list
On a similar note, this year’s Top100 also underperformed against their peers. As a group, they lagged the rest of the S&P 500 by 1.9 percent points. While we have experienced a bigger divergence in performance between overpaid and non-overpaid in other years, the favorable economic outlook of 2019 allowed for less of a difference. Nevertheless, if the highest paid CEOs did not manage to outperform their peers with the economic tailwinds of 2019, when are they supposed to do so?
Our analyses throughout the years point out that is not any clear relationship between high CEO pay and improved company performance. This year this appears to be evermore clear, as high paid CEOs failed to deliver superior returns during favorable market conditions.
Figure 4 - 2019 Overpaid CEOs Slightly Underperform
FIGURE 4: 2019 OVERPAID CEOS SLIGHTLY UNDERPERFORM
4.84-Year Total shareholder Return (TSR)
from 02/31/15 to 12/31/19 of the 2019 Overpaid list
The trend we observed in Figure 3 is reinforced and made more visible over the almost 5- year period illustrated in Figure 4. Taking this year’s list of Top100 firms which overpay their CEOs, we are able to see a similar performance to the list from 2015. The trend therefore persists, where there is no proven connection between pay and performance.
In light of this, we should pay attention to what the compensation packages of the companies we invest in look like. Allocating the capital differently within the company may lead to improved long-term growth and returns for shareholders.
Your portfolio is your money. The companies and funds you invest in should be aligned with your values and way of seeing the world. However, the most overpaid CEO pay packages are approved by Boards, elected by you the investor, and the mutual funds who
hold their stocks. We encourage you as investors to speak up, vote your “say on pay,” and pressure the companies and funds in your portfolio with this evidence – which can benefit your long-term financial performance and a more appropriate level of rewards for results achieved.
The aggregated information comprising The Most Overpaid CEOs 2020 represents a snapshot in time of publicly available information regarding shareholder voting with U.S. public companies.
The information provided in The Most Overpaid CEOs 2020 is provided “AS IS” without warranty of any kind. As You Sow makes no representations and provides no warranties regarding any information or opinions provided herein, including, but not limited to, the advisability of investing in any particular company or investment fund or other vehicle. While we have obtained information believed to be objectively reliable, As You Sow or any of its employees, officers, directors, trustees, or agents, shall not be responsible or liable, directly or indirectly, for any damage or loss caused or alleged to be caused by or in connection with use of or reliance on any information contained herein, including, but not limited to, lost profits or punitive or consequential damages. Past performance is not indicative of future returns.
As You Sow does not provide investment, financial planning, legal, or tax advice. We are neither licensed nor qualified to provide any such advice. The content of our programming, publications, and presentations is provided for informational and educational purposes only and should not be considered as information sufficient upon which to base any decisions on investing, purchases, sales, trades, or any other investment transactions. We do not express an opinion on the future or expected value of any security or other interest and do not explicitly or implicitly recommend or suggest an investment strategy of any kind.
Our events, websites, and promotional materials may contain external links to other resources, and may contain comments or statements by individuals who do not represent As You Sow. As You Sow has no control over, and assumes no responsibility for the content, privacy policies, or practices of any third-party websites or services that you may access as a result of our programming. As You Sow shall not be responsible or liable, directly or indirectly, for any damage or loss caused or alleged to be caused by or in connection with use of or reliance on any such content, goods or services available on or through any such websites or services.
Copyright © 2020 As You Sow. All rights reserved.
Papadopoulos, Kosmos. “ISS Offers Early Take on 2019 U.S. Proxy Season Vote Results.” The CLS Blue Sky Blog, 13 Jun. 2019, clsbluesky.law.columbia.edu/2019/06/13/iss-offers-early-take-on-2019-u-s-proxy-season-vote-results/#.XQL4kxibG7M.twitter.
Mishel, Lawrence and Wolfe, Julia. “CEO Compensation has Grown 940% Since 1978.” Economic Policy Institute, 14 Aug. 2019, https://www.epi.org/publication/ceo-compensation-2018.
“The Effect of Say on Pay Failures.” Equilar, 3 Oct. 2019, www.equilar.com/blogs/428-the-effects-of-say-on-pay-failures.html.
Bi, Ran. “CEO Pay Mix Changes Following Say on Pay Failures.” Harvard Law School Forum on Corporate Governance, 23 Feb. 2019. https://corpgov.law.harvard.edu/2019/02/23/ceo-pay-mix-changes-following-say-on-pay-failures.
Mooney, Attracta. “How Asset Managers Turned Into Business Agitators.” Financial Times, 22 Dec. 2019, https://www.ft.com/content/f568ec48-1840-11ea-8d73-6303645ac406.
Papadopoulos, Kosmos. “ISS Offers Early Take on 2019 U.S. Proxy Season Vote Results.” The CLS Blue Sky Blog, 13 Jun. 2019, clsbluesky.law.columbia.edu/2019/06/13/iss-offers-early-take-on-2019-u-s-proxy-season-vote-results/#.XQL4kxibG7M.twitter.
Larcker, David F. and Tayan, Brian. “Pay for Performance...But Not Too Much Pay: The American Public’s View of CEO Pay.” Stanford Business, Nov. 2019, https://www.gsb.stanford.edu/faculty-research/publications/pay-performance-not-too-much-pay-american-publics-view-ceo-pay.
Francis, Theo and Fuhrmans, Vanessa “Big Companies Pay CEOS for Good Performance – and Bad.” The Wall Street Journal, 17 May 2019, https://www.wsj.com/articles/big-companies-pay-ceos-for-good-performanceand-bad-11558085402?mod=article_inline.
Mishel, Lawrence and Wolfe, Julia. “CEO Compensation has Grown 940% Since 1978.” Economic Policy Institute, 14 Aug. 2019, https://www.epi.org/publication/ceo-compensation-2018.
Taylor, Telford. “Income Inequality in America is the Highest it’s Been Since Census Bureau Started Tracking it, Data Shows.” The Washington Post, 26 Sept. 2019, https://www.washingtonpost.com/business/2019/09/26/income-inequality-america-highest-its-been-since-census-started-tracking-it-data-show.
Paddison, Laura. “Just 162 Billionaires Have the Same Wealth as Half of Humanity.” The Huffington Post, 19 Jan. 2020, https://www.huffpost.com/entry/billionaires-inequality-oxfam-report-davos_n_5e20db1bc5b674e44b94eca5?guccounter=1.
Sargent, Greg. “The Massive Triumph of the Rich, Illustrated by Stunning New Data.” The Washington Post, 9 Dec. 2019, https://www.washingtonpost.com/opinions/2019/12/09/massive-triumph-rich-illustrated-by-stunning-new-data.
Wu, Tim. “The Revolution Comes to Davos.” The New York Times, 23 Jan. 2020, https://www.nytimes.com/2020/01/23/opinion/sunday/davos-2020-capitalism-climate.
Letter to Boeing Board of Directors. United States Senate, 13 Jan. 2020, https://www.baldwin.senate.gov/imo/media/doc/Boeing%20CEO%20Pay.pdf.
Gelles, David. “Fired Boeing C.E.O. Muilenburg Will Get More Than $60 Million.” The New York Times, 10 Jan. 2020. https://www.nytimes.com/2020/01/10/business/boeing-dennis-muilenburg-severance.html.
Letter to Boeing Board of Directors. United States Senate, 13 Jan. 2020, https://www.baldwin.senate.gov/imo/media/doc/Boeing%20CEO%20Pay.pdf.
Tlaib, Rashida. “The US Should Tax Excessive CEO Compensation | Opinion.” Detroit Free Press, 3 Dec. 2019, https://www.freep.com/story/opinion/contributors/2019/12/03/u-s-should-tax-excessive-ceo-compensation/4332536002/.
Stevens, Matt. “Sanders Proposes Corporate Tax to Address Pay Gap at Big Companies.” The New York Times, 1 Oct. 2019, https://www.nytimes.com/2019/09/30/us/politics/bernie-sanders-tax-proposal.html.
Symon, Evan. “California Businesses Could Face Higher Taxes Based on Gap Between Highest and Lowest Wages.” California Globe, 6 Feb. 2020. https://californiaglobe.com/section-2/california-businesses-could-face-higher-taxes-based-on-gap-between-highest-and-lowest-wages/.
Woolf, Nicky. “Portland City Council Passes Tax on CEOS who Earn 100 Times More Than Staff.” The Guardian, 8 Dec. 2016. https://www.theguardian.com/us-news/2016/dec/08/portland-oregon-ceo-pay-tax-passes-income-inequality.
“BTAR 500.17-1 Pay Ratio Surtax.” The City of Portland, 26 Sept. 2017, https://www.portlandoregon.gov/revenue/article/656905. Accessed 5 Feb. 2020.
Edgecliff, Andrew. “Potential Pay-off for Boeing Boss Show Limits of Business Pledges.” Financial Times, 3 Jan. 2020, https://www.ft.com/content/5725b358-2dea-11ea-bc77-65e4aa615551.
“Statement on Proposals to Restrict Shareholder Voting.” U.S. Securities and Exchange Commission, 5 Nov. 2019, https://www.sec.gov/news/public-statement/statement-jackson-2019-11-05-open-meeting.
“Comment Letter.” First Affirmative, 3 Jan. 2020, https://www.sec.gov/comments/s7-22-19/s72219-6608370-202798.pdf.
Schacht, Kurt. “Is the SEC Proxy Proposal Analyst Retaliation?” Nasdaq, 3 Dec. 2019, https://www.nasdaq.com/articles/is-the-sec-proxy-proposal-analyst-retaliation-2019-12-03.
“Determining the EJPS Compensation Rating.” Egan-Jones Proxy Services, Version 2019-11-15(a), https://ejproxy.com/media/documents/20191115-Compensation_Rating_Summary.pdf. Accessed 5 Feb. 2020.
“The Company - About Us.” PIRC, http://www.pirc.co.uk/?page_id=32. Accessed 5 Feb. 2020.
McLaughlin, David and Massa, Annie. “The Hidden Dangers of the Great Index Fund Takeover.” Bloomberg, 9 Jan. 2020. https://www.bloomberg.com/news/features/2020-01-09/the-hidden-dangers-of-the-great-index-fund-takeover.
McLaughlin, Tim and Kerber, Ross, “Index Funds Invest Trillions but Rarely Challenge Management.” Reuters Business News, 8 Oct. 2019, https://www.reuters.com/article/us-usa-funds-index-specialreports/special-report-index-funds-invest-trillions-but-rarely-challenge-management-idUSKBN1WN107.
Sommer, Jeff. “Want a Bigger Say on Corporate Behavior? Move Your Money.” The New York Times, 12 Dec. 2019, https://www.nytimes.com/2019/12/12/business/corporate-behavior-move-your-money.html?searchResultPosition=1.
McLaughlin, Tim & Kerber, Ross, “Index Funds Invest Trillions but Rarely Challenge Management.” Reuters Business News, 8 Oct. 2019, https://www.reuters.com/article/us-usa-funds-index-specialreports/special-report-index-funds-invest-trillions-but-rarely-challenge-management-idUSKBN1WN107.
“BlackRock 2019 Investment Stewardship Annual Report.” Blackrock, Aug. 2019, p. 26, https://www.blackrock.com/corporate/literature/publication/blk-annual-stewardship-report-2019.pdf.
Ibid., p. 15.
“Climate in the Boardroom: How Asset Manager Voting Shaped Corporate Climate Action in 2019.” Majority Action, https://www.majorityaction.us/asset-manager-report. Accessed 5 Feb. 2020.
Gryta, Thomas and Mann Ted. “GE Powered the American Century – Then it Burned Out.” The Wall Street Journal, 14 Dec. 2018, https://www.wsj.com/articles/ge-powered-the-american-centurythen-it-burned-out-11544796010.
Wigglesworth, Robin and Henderson, Richard. “Vanguard and the US Financial System: Too Big to Be Healthy?” Financial Times, 12 Jan 2020, https://www.ft.com/content/9414052a-3142-11ea-9703-eea0cae3f0de.
“Proxy Voting Guidelines for U.S. Portfolio Companies.” Vanguard, 1 Apr. 2019, p. 12, https://about.vanguard.com/investment-stewardship/portfolio-company-resources/proxy_voting_guidelines.pdf.
“2019 Vanguard Investment Stewardship Report.” Vanguard, p. 34, https://about.vanguard.com/investment-stewardship/perspectives-and-commentary/2019_investment_stewardship_annual_report.pdf.
“Stewardship Report 2018-19.” State Street Global Advisors, p. 86, https://www.ssga.com/library-content/products/esg/annual-asset-stewardship-report-2018-19.pdf. Accessed 5 Feb 2020.
Ibid., p. 94.
Landell-Mills, Natasha. “What has Gone Wrong with Pay? And What Investors Should do About It.” Sarasin & Partners, LLP, 2017.
Thomas, Jerry. “Stewardship Report: Is Executive Pay Reform Becoming a Reality?” Sarasin & Partners, Edition 5, 2018, p 15.
Flood, Chris. “European Investors Target Lavish Executive Pay in US: Tougher Stance Taken by EU Funds on S&P 500 Remuneration Awards than American Peers.” Financial Times, 29 Sept. 2019, https://www.ft.com/content/25ce08b4-fb7b-3515-bd5b-361d3eadda7e.
“Azzad’s Updated Proxy Voting Guidelines.” Azzad, 5 Sept. 2019. https://www.azzadfunds.com/azzads-updated-proxy-voting-guidelines/.
“Green Century Capital Management Proxy Voting Policies and Procedures.” Proxyinsight, 22 Nov. 2018, https://www.proxyinsight.com/members/Investor_DOCs/Employees'%20Retirement%20System%20of%20Georgia%20Voting%20Policy.pdf.
“Equilar and CalPERS Release New Pay for Performance Scorecard.” Equilar, 23 Sept. 2019. https://www.equilar.com/press-releases/116-equilar-calpers-release-new-p4p-scorecard.html?utm_source=newsletter&utm_medium=email&utm_campaign=executive&utm_content=190926.
“CalPERS’ Executive Compensation Analysis Framework.” CalPERS, Aug. 2019, p. 4, https://www.calpers.ca.gov/docs/executive-compensation-analysis-framework.pdf.
Ibid., p. 5.
Melin, Anders. “Calpers Ups Pressure on Companies Over Executive Pay, Harassment.” Bloomberg, 18 Sept. 2018, https://www.bloomberg.com/news/articles/2018-09-18/calpers-ups-pressure-on-companies-over-executive-pay-harassment.
Mooney, Attracta. “How Asset Managers Turned into Business Agitators,” Financial Times, 22 Dec. 2019, https://www.ft.com/content/f568ec48-1840-11ea-8d73-6303645ac406.
“ESG Engagement in Public Markets.” BCI, 2019, p. 7, https://www.bci.ca/wp-content/uploads/2018/02/bci-esgengagement.pdf.
“2019 Ninth Edition, Proxy Voting Guidelines.” BCI, https://www.bci.ca/approach/responsible-investing/proxy-voting-record. Accessed 5 Feb. 2020.
“Responsible Investing, Annual Report,” BCI, 2018, p. 17, https://www.bci.ca/wp-content/uploads/2019/04/responsible-investing-annual-report-2018.pdf.
Magaziner, Seth. “2019 Shareholder Engagement Overview.” Office of the General Treasurer, State of Rhode Island, 2019, https://d10k7k7mywg42z.cloudfront.net/assets/5d6e690321c79b1704a9f3da/RI_shareholder_engagement_2019.pdf. Accessed 5 Feb. 2020.
Ibid., p. 5.
Littleton, Cynthia. “Bob Iger’s Disney Compensation Drops to $47.5 Million in 2019.” Variety, 17 Jan. 2020, https://variety.com/2020/biz/news/bob-iger-disney-2019-compensation-47-5-million-1203471380/.
Rosanna Landis Weaver,
Program Manager, Power of the Proxy: Executive Compensation, As You Sow®
This is the sixth annual report of The 100 Most Overpaid CEOs of the S&P 500: Are Fund Managers Asleep at the Wheel? that Rosanna Landis Weaver has written for As You Sow. Weaver began her corporate governance career with a position in the corporate affairs office at the International Brotherhood of Teamsters in 1992, supervising research on corporate governance. In 1999 she joined the Investor Responsibility Research Center (IRRC) where she wrote reports on compensation-related shareholder proposals and golden parachutes. At Institutional Shareholder Services (ISS), which she joined in 2005, she was a senior analyst on the executive compensation team, with a particular focus on change of control agreements, and analyzed Say-on-Pay resolutions. From 2010 to 2012, she was the governance initiatives coordinator at Change to Win. Weaver holds a bachelor’s degree in English from Goshen College and a master’s in American Studies from the University of Notre Dame.
Throughout the spring, as proxies are filed, Weaver provides updates and compensation analysis on her blog, which can be found at https://www.asyousow.org/our-work/ceo-pay/blog/. You can sign up for emails that summarize these blog posts during proxy season at https://go.asyousow.org/ceo-pay-alerts.
This report was made possible by the generous support of the Stephen M. Silberstein Foundation. Additional support was provided by the Arkay Foundation, Arntz Family Foundation, Firedoll Foundation, Hanley Foundation, Libra Foundation, Manaaki Foundation, Roddenberry Family Foundation, Singing Field Foundation, and Thornton Foundation.
Special thanks to:
The Proxy Insight database is highly valuable. Seth Duppstadt, Sophie Miles, and Oliver Taylor provided us with reams of data and remained patient with answering specific questions.
The Human Impact + Profit (HIP) Investor team conducted the regression analysis, upon which a key component of this report rests. HIP Investor (www.HIPInvestor.com, founded in 2006, rates 127,000 investments (stocks, bonds, funds) on all aspects of sustainability (including corporate CEO pay) and how it can correlate to future risk and return potential. Onindo Khan, R. Paul Herman (HIP’s CEO), Erik Nielsen, and Noah Strouse were helpful and responsive throughout the process.
Robert Reich’s support for this project and the fight to address income inequality has always been an inspiration. His insights during our webinars adds expert high-level tested wisdom and expands our reach beyond the shareholder advocacy community. We are very grateful to him and his staff at Inequality Media.
Peer reviewers Sam Pizzigati (author of “The Case for A Maximum Wage”), Larry Mishel from the Economic Policy Institute, Louis Malizia and Michael Pryce-Jones of the Teamsters.
The As You Sow team; (alphabetically by last name) Andrew Behar, Sharon Cho, Jill Courtenay, Sarah Milne, Natalie Romero, Stefanie Spear, David Shugar and Sasha Thomas-Nuruddin. Thanks also to the digital design team Greg Barbosa, Susan Honea, Miriam Holzman-Sharman, and John Opet of Art270.