
Carbon Clean 200®:
Investing in a Clean Energy Future
2026 Performance Update


The Clean200® is an educational tool intended to give individuals the ability to research companies that are effectively balancing people, planet, and profit. The Clean200 list may be used by individuals free of charge. All commercial investment products derived from the Clean200 requires a license. Contact [email protected] and/or Corporate Knights Inc. for further information.
Foreword
In the first weeks of 2026, clean energy became a punching bag again with President Trump using the Davos stage to denounce renewables and deride “money losing windmills”. Clearly the politics aren’t on clean energy’s side, at least not in Washington.
But what do the markets actually say?
In the US, clean energy and clean transportation investment hit a record USD $75 billion in Q3 2025, the highest quarterly total on record. Companies are not backing off wind either: industry forecasts expected more than 7 GW of wind installations in 2025 (about 36% more than 2024). This isn’t surprising when you look at the underlying economics. The US Energy Information Administration comparisons show new onshore wind is among the lowest-cost new power sources at about $29.6/MWh for plants entering service in 2030—roughly on par with solar PV (~$31.9/MWh) and well below new natural-gas combined cycle (~$64.6/MWh).
The implication is clear: there are tremendous business opportunities for forward-looking leaders who focus on fundamentals and execution. That’s why the Clean200 follows revenues, not rhetoric: the global clean economy is increasingly advancing on fundamentals, even when the US politics turns hostile.
In 2025, the transition’s real test wasn’t technology—it was infrastructure. Data centers accounted for 1.5% of global demand in 2024 and that load has been growing roughly 12% per year, with AI accelerating the trend. In practice, 2025 clarified a key nuance: when demand grows faster than grids can connect new clean supply, the system leans on whatever is already dispatchable—often fossil fuels—at the margin. That dynamic showed up in the U.S., where coal generation rose 13% in 2025, even as clean investments kept growing.
Globally, the capital allocation signal remained clear. The International Energy Agency projected global energy investment would reach about $3.3 trillion in 2025, with around $2.2 trillion going to clean energy technologies—nearly double fossil fuels. In other words: fossils can still win the next hour; clean energy is winning the next decade.
Electrification reinforced that momentum. Global EV sales reached 20.7 million in 2025, up 20% from 17.1 million in 2024. Growth was uneven: Europe rose 33% and China 17%, while North America fell 4%—showing the transition is accelerating globally even as some markets hit policy and affordability headwinds. That momentum is also supported by sliding battery costs: BloombergNEF puts average lithium-ion pack prices at $108/kWh in 2025, down from $115 in 2024 and $139 in 2023 (US$84/kWh in China, the lowest globally).
Decarbonization also pushed deeper into hard-to-abate sectors. A notable 2025 milestone: the International Maritime Organization approved an IMO Net-Zero Framework combining a global marine fuel standard with a GHG pricing mechanism for large ships, set up for formal adoption later in 2025 and entry into force in 2027. Even where debate remains on ambition, the direction is clear: climate rules are hardening in global sectors.
Still, some parts of the transition hit a reality check. The “hydrogen reset” showed markets maturing. Developers scrapped or delayed projects as costs and demand gaps widened. Rather than a retreat, this looked like discipline — capital rotating toward nearer-term winners (grids, storage, electrification, efficiency) while hydrogen narrows toward uses where molecules truly outperform electrons.
What this means for the Clean200
The Clean200 follows sustainable revenues — where the world is already buying solutions at scale. In 2025, the sustainable economy became more electricity-dependent, and more infrastructure-constrained: AI-driven demand exposed grid bottlenecks, while capital continued to pour into clean power, storage, electrification and enabling supply chains. For investors and business leaders, the question has shifted from whether the transition is happening to which companies are positioned to supply what the global economy is now structurally demanding.
This year’s Clean200 was selected from 8,229 global companies based on a rigorous assessment of how much revenue each earns from products and services aligned with the Corporate Knights Sustainable Economy Taxonomy. At the same time, companies were screened to ensure they are not fundamentally offside key responsible-investing criteria, including flags identified through As You Sow’s Invest Your Values platform—such as involvement in fossil fuels, deforestation, weapons, private prisons, or thermal coal, or a record of systematically obstructing climate policy.
Key Findings:
This year’s Clean200 is concentrated in the Asia-Pacific region (36%), Europe (33%), and North America (26%), with the remaining 5% headquartered in South America. The United States led the 2026 ranking with 41 companies, followed by China with 28 and Japan with 15.
Across the Clean200, companies derive an average of 53.7% of revenue from activities classified as sustainable, representing over $2.8 trillion in revenue, well above the 16.7% average sustainable revenue share among their MSCI ACWI peers.
Among firms included in the 2026 Clean200, the Information Technology sector generated the largest portion of sustainable revenue, contributing $782 billion (over one-quarter of the total). Consumer Discretionary followed with $649 billion, and Industrials with $611 billion.
And it’s not just the climate case that holds up—the returns do, too. As of January 26, 2026, the Clean200—measured on a sustainable revenue-weighted basis—generated a total return (gross, USD) of 282.9% since its July 1, 2016 inception, compared with 111.0% for the MSCI ACWI/Energy Index of fossil fuel companies.
To put it in another way, $10,000 invested in the Clean200 on July 1, 2016 would have grown to $38,290 by January 26, 2026, versus $21,100 for the MSCI ACWI/Energy fossil fuel benchmark.
Over the same period, the Clean200 also outpaced the broader MSCI ACWI, which returned 221.3%.
Corporate Knights and As You Sow are pleased to present the latest edition of the Clean200 designed to help investors identify companies advancing climate solutions while outperforming both the broad-based benchmark and its high-carbon global counterparts.
Clean200 vs MSCI ACWI vs MSCI ACWI/Energy
(July 1, 2016–Jan. 26, 2026, Total Return USD Gross)
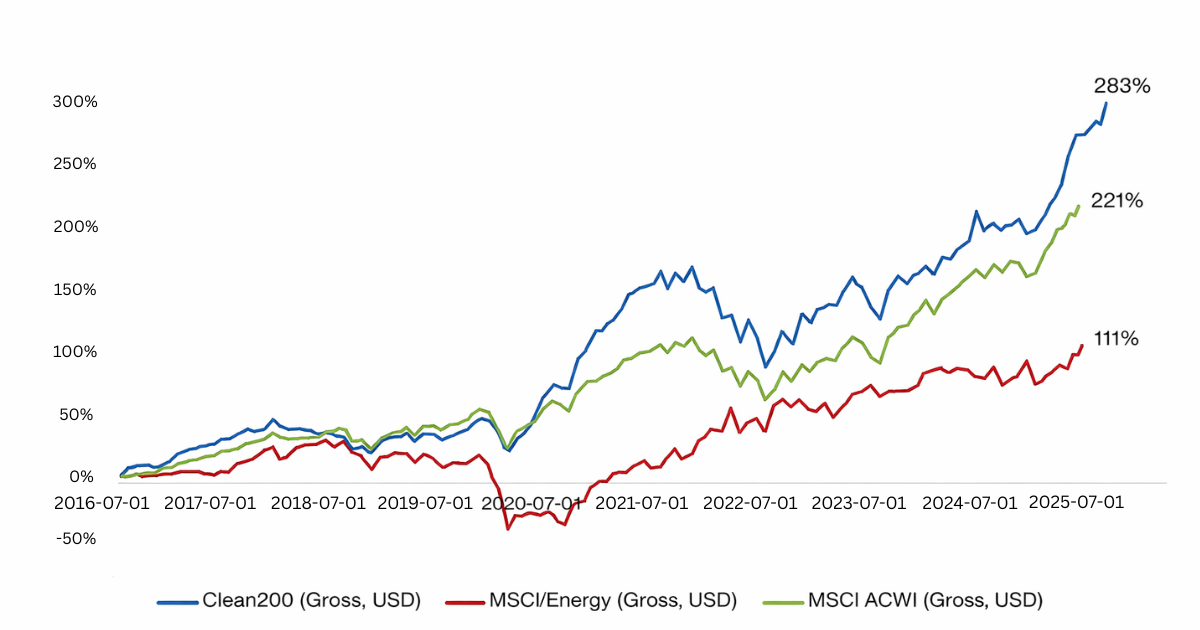
Source: LSEG Workspace
Clean200 Companies by Sector
| GICS Sector | # of Clean200 Companies |
|---|---|
| Industrials | 50 |
| Consumer Discretionary | 32 |
| Materials | 30 |
| Information Technology | 27 |
| Utilities | 20 |
| Health Care | 20 |
| Communication Services | 14 |
| Consumer Staples | 4 |
| Financials | 2 |
| Real Estate | 1 |
Clean200 Companies by Country
| Country | # of Clean200 Companies |
|---|---|
| United States | 41 |
| China | 28 |
| Japan | 15 |
| France | 12 |
| Canada | 11 |
| Germany | 11 |
| Spain | 8 |
| Brazil | 8 |
| Taiwan | 8 |
| South Korea | 7 |
| Denmark | 7 |
| United Kingdom | 5 |
| Sweden | 5 |
| India | 5 |
| Hong Kong | 3 | Austria | 3 |
| Finland | 3 |
| Ireland | 3 |
| Australia | 3 |
| Netherlands | 2 |
| Switzerland | 2 |
| Turkey | 2 |
| Mexico | 1 |
| Colombia | 1 |
| Thailand | 1 |
| Norway | 1 |
| Chile | 1 |
| New Zealand | 1 |
| Luxembourg | 1 |
| Italy | 1 |
The Clean200® Methodology
The Clean200 are the largest 200 public companies ranked by clean revenue. The ranking was first calculated on July 1, 2016, and publicly released on August 15, 2016, by Corporate Knights and As You Sow. The current list has been updated with data through January 20, 2026.
The Clean200 companies are ranked by their clean revenues in U.S. dollars3. The data set is developed through assessment of a company’s revenue that aligns with the definitions laid out in the Corporate Knights Sustainable Economy Taxonomy, primarily sourced from Corporate Knights research. To be eligible, a company must earn more than 10% of total revenues from clean sources.
The Clean200 uses negative screens. It excludes all oil and gas companies, all utilities that generate less than 50% of their power from green sources, the top 100 coal companies measured by reserves, the top 100 oil and gas companies as measured by reserves, as well as all fossil fuel companies, majority fossil-fired utilities, pipeline, and oil-field-services companies, and other fossil-fuel-related companies screened on As You Sow’s Fossil Free Funds. In addition, the Clean200 excludes weapons companies, including major military arms manufacturers found on the Stockholm International Peace Research Institute (SIPRI) Top 100 arms-producing and military services list, as well as cluster munitions, nuclear weapons, and civilian firearm manufacturers screened on As You Sow’s Weapon Free Funds. The Clean200 also excludes palm oil, paper/pulp, rubber, timber, cattle, and soy producers that are screened on As You Sow’s Deforestation Free Funds; companies that use child or forced labor, are involved in the manufacture of harmful pesticides, and that engage in negative climate lobbying are not included. The full list of exclusionary screens is provided below.
| Screen | Criteria | # Excluded |
|---|---|---|
| Blocking climate policy | Categorized by the InfluenceMap lobbying red flag metric, which highlights companies that are engaged in corporate lobbying on climate change. (Source: CK) | 3 |
| Cement carbon laggards | Companies in the cement industry that were divested from by Norges Bank Investment Management (NBIM). (Source: CK) | 0 |
| Deforestation-risk agribusiness producer/trader | Company engages in deforestation in South America and Southeast Asia as deemed by Chain Reaction research, Deforestation Free Funds, or was divested from by NBIM. (Source: CK + AYS) | 8 |
| Coal Industry | Company has coal industry classification, or is found on the Global Coal Exit list from Urgewald. (Source: CK + AYS) | 6 |
| Oil & gas industry | Company has industry classification of oil/gas, or is found on the Global Oil/Gas Exit list from Urgewald. (Source: CK + AYS) | 10 |
| Fossil-fired utilities | Company has industry classification of utilities, has fossil fuel power generation or gas distribution, and has less than 50% clean revenue, as calculated by Corporate Knights. (Source: CK + AYS) | 54 |
| Fossil fuel financiers | Company is found on the Banking on Climate Chaos list of the 60 largest commercial and investment banks that are lending to and underwriting debt/equity issuances of fossil fuel companies, or from Corporate Knights research. (Source: AYS) | 1 |
| Fossil fuel insurers | Company is found on the Insure Our Future list of 30 leading primary insurers and reinsurers that are insuring and investing in coal, oil, gas. (Source: AYS) | 2 |
| Conventional weapons | Company is found on the list of the top 100 military contractors, or company earns more than half of its revenue from conventional weapons, as tracked by the Stockholm International Peace Research Institute (SIPRI). (Source: CK) | 6 |
| Prisons | Company is recommended for divestment by the Investigate project of the American Friends Service Committee. (Source: CK + AYS) | 0 |
| Top 200 carbon reserve owners | Company ranks in The Carbon Underground 200™, compiled and maintained by FFI Solutions (formerly Fossil Free Indexes℠), which identifies the top 100 coal and the top 100 oil/gas publicly traded reserve holders globally. (Source: AYS) | 1 |
| Controversial weapons | Company sells controversial weapons and is deemed ineligible for investment by NBIM and NZ SuperFund. (Source: CK) | 1 |
| Illegal activity | Company’s ratio of fines, penalties or settlements/revenue for the most recent ranked year exceeds 1.0%. (Source: CK) | 1 |
| Severe environmental damage and Severe human rights violations | Identifies companies that have caused several environmental damage or are involved in severe human rights violations and have been excluded by NBIM/CK Research. (Source: CK) | 9 |
| Harmful pesticides | The top five pesticide manufacturers selling chemicals that pose serious hazards to human health and the environment. (Source: Unearthed) | 1 |
The Clean200® List
| Rank | Name | Country | GICS Sector |
|---|---|---|---|
| 1 | Apple Inc | United States of America | Information Technology |
| 2 | Amazon.com Inc | United States of America | Consumer Discretionary |
| 3 | Microsoft Corp | United States of America | Information Technology |
| 4 | Tesla Inc | United States of America | Consumer Discretionary |
| 5 | Contemporary Amperex Technology Co Ltd | China | Industrials |
| 6 | Byd Co Ltd | China | Consumer Discretionary |
| 7 | Taiwan Semiconductor Manufacturing Company Limited | Taiwan | Information Technology |
| 8 | NVIDIA Corp | United States of America | Information Technology |
| 9 | Volkswagen AG | Germany | Consumer Discretionary |
| 10 | China Railway Group Ltd | China | Industrials |
| 11 | HP Inc | United States of America | Information Technology |
| 12 | Bayerische Motoren Werke AG | Germany | Consumer Discretionary |
| 13 | Industria de Diseno Textil SA | Spain | Consumer Discretionary |
| 14 | LG Energy Solution, Ltd. | South Korea | Industrials |
| 15 | LG Chem Ltd | South Korea | Materials |
| 16 | Lenovo Group Ltd | Hong Kong | Information Technology |
| 17 | Iberdrola SA | Spain | Utilities |
| 18 | Schneider Electric SE | France | Industrials |
| 19 | Alstom SA | France | Industrials |
| 20 | Vestas Wind Systems A/S | Denmark | Industrials |
| 21 | Nokia Oyj | Finland | Information Technology |
| 22 | Merck & Co Inc | United States of America | Health Care |
| 23 | Telefonaktiebolaget LM Ericsson | Sweden | Information Technology |
| 24 | Banco do Brasil SA | Brazil | Financials |
| 25 | Bristol-Myers Squibb Co | United States of America | Health Care |
| 26 | CRRC Corp Ltd | China | Industrials |
| 27 | Smurfit WestRock PLC | Ireland | Materials |
| 28 | Neoenergia SA | Brazil | Utilities |
| 29 | Sungrow Power Supply Co Ltd | China | Industrials |
| 30 | Cisco Systems Inc | United States of America | Information Technology |
| 31 | Novo Nordisk A/S | Denmark | Health Care |
| 32 | Geely Automobile Holdings Ltd | Hong Kong | Consumer Discretionary |
| 33 | Vinci SA | France | Industrials |
| 34 | Li Auto Inc | China | Consumer Discretionary |
| 35 | Rio Tinto Ltd | Australia | Materials |
| 36 | Sanofi SA | France | Health Care |
| 37 | Seres Group Co.,Ltd | China | Consumer Discretionary |
| 38 | NIO Inc | China | Consumer Discretionary |
| 39 | GlaxoSmithKline PLC | Health Care | United Kingdom |
| 40 | Acciona SA | Spain | Utilities |
| 41 | Steel Dynamics Inc | United States of America | Materials |
| 42 | Johnson Controls International PLC | Ireland | Industrials |
| 43 | Volvo Car AB (publ.) | Sweden | Consumer Discretionary |
| 44 | Central Japan Railway Co | Japan | Industrials |
| 45 | Prysmian SpA | Italy | Industrials |
| 46 | Bouygues SA | France | Industrials |
| 47 | AT&T Inc | United States of America | Communication Services |
| 48 | Ricoh Co Ltd | Japan | Information Technology |
| 49 | Goldwind Science & Technology Co., Ltd. | China | Industrials |
| 50 | Fresenius Medical Care AG | Germany | Health Care |
| 51 | Asustek Computer Inc | Taiwan | Information Technology |
| 52 | Verizon Communications Inc | United States of America | Communication Services |
| 53 | China United Network Communications Ltd | China | Communication Services |
| 54 | SAP SE | Germany | Information Technology |
| 55 | Abb Ltd | Switzerland | Industrials |
| 56 | East Japan Railway Co | Japan | Industrials |
| 57 | Nike Inc | United States of America | Consumer Discretionary |
| 58 | Adidas AG | Germany | Consumer Discretionaryy |
| 59 | CPFL Energia SA | Brazil | Utilities |
| 60 | Gilead Sciences Inc | United States of America | Health Care |
| 61 | Nordex SE | Germany | Industrials |
| 62 | DaVita Inc | United States of America | Health Care |
| 63 | CEMIG | Brazil | Utilities |
| 64 | Kering SA | France | Consumer Discretionary |
| 65 | Telefonica SA | Spain | Communication Services |
| 66 | Essity AB | Sweden | Consumer Staples |
| 67 | XPeng Inc. | China | Consumer Discretionary |
| 68 | Tianneng Power International Ltd | China | Consumer Discretionary |
| 69 | Enerjisa Enerji AS | Turkey | Utilities |
| 70 | Johnson & Johnson | United States of America | Health Care |
| 71 | T-Mobile US Inc | United States of America | Communication Services |
| 72 | Enerjisa Enerji AS | Turkey | Utilities |
| 73 | Verbund AG | Austria | Utilities |
| 74 | T-Mobile US Inc | United States of America | Communication Services |
| 75 | Enel Americas SA | Chile | Utilities |
| 76 | Energisa SA | Brazil | Utilities |
| 77 | Guangzhou Automobile Group Co Ltd | China | Consumer Discretionary |
| 78 | WSP Global Inc | Canada | Industrials |
| 79 | Dassault Systemes SE | France | Information Technology |
| 80 | Arcelik AS | Turkey | Consumer Discretionary |
| 81 | Trane Technologies PLC | Ireland | Industrials |
| 82 | Orange SA | France | Communication Services |
| 83 | Orsted A/S | Denmark | Utilities |
| 84 | Signify NV | Netherlands | Industrials |
| 85 | Hyundai Mobis Co Ltd | South Korea | Consumer Discretionary |
| 86 | Outokumpu Oyj | Finland | Materials |
| 87 | Quanta Services Inc | United States of America | Industrials |
| 88 | GEM Co Ltd | China | Materials |
| 89 | Hanwha Solutions Corp | South Korea | Materials |
| 90 | Legrand SA | France | Industrials |
| 91 | Newmont Corporation | United States of America | Materials |
| 92 | Ball Corp | United States of America | Materials |
| 93 | UACJ Corp | Japan | Materials |
| 94 | Dr. Ing. h.c. F. Porsche AG | Germany | Consumer Discretionary |
| 95 | Abbott Laboratories | United States of America | Health Care |
| 96 | West Japan Railway Co | Japan | Industrials |
| 97 | Ecolab Inc | United States of America | Materials |
| 98 | China Three Gorges Renewables Group Co Ltd | China | Utilities |
| 99 | Yadea Group Holdings Ltd | China | Consumer Discretionary |
| 100 | Vodafone Group PLC | United Kingdom | Communication Services |
| 101 | Takeda Pharmaceutical Co Ltd | Japan | Health Care |
| 102 | Republic Services Inc | United States of America | Industrials |
| 103 | Konica Minolta Inc | Japan | Information Technology |
| 104 | Companhia Paranaense de Energia | Brazil | Utilities |
| 105 | Verbund AG | Austria | Utilities |
| 106 | Xylem Inc | United States of America | Industrials |
| 107 | Crown Holdings Inc | United States of America | Materials |
| 108 | Delta Electronics Thailand PCL | Thailand | Information Technology |
| 109 | Commercial Metals Co | United States of America | Materials |
| 110 | Brambles Ltd | Australia | Industrials |
| 111 | Bridgestone Corp | Japan | Consumer Discretionary |
| 112 | Infineon Technologies AG | Germany | Information Technology |
| 113 | Aperam SA | Luxembourg | Materials |
| 114 | Air Liquide S.A. | France | Materials |
| 115 | Equinix Inc | United States of America | Information technology |
| 116 | H & M Hennes & Mauritz AB | Sweden | Consumer Discretionary |
| 117 | BCE Inc | Canada | Communication Services |
| 118 | FirstGroup PLC | United Kingdom | Industrials |
| 119 | Great Wall Motor Co Ltd | China | Consumer Discretionary |
| 120 | Rexel SA | France | Industrials |
| 121 | Canadian National Railway Co | Canada | Industrials |
| 122 | Acerinox SA | Spain | Materials |
| 123 | Koninklijke Philips NV | Netherlands | Health Care |
| 124 | Zhuzhou CRRC Times Electric Co Ltd | China | Industrials |
| 125 | Rengo Co Ltd | Japan | Materials |
| 126 | Telus Corp | Canada | Communication Services |
| 127 | Gotion High-tech Co Ltd | China | Industrials |
| 128 | Cellnex Telecom SA | Spain | Communication Services |
| 129 | Manulife Financial Corp | Canada | Financials |
| 130 | Boston Scientific Corp | United States of America | Health Care |
| 131 | Rockwool A/S | Denmark | Industrials |
| 132 | Beijing Enterprises Water Group Ltd | Hong Kong | Utilities |
| 133 | Risen Energy Co Ltd | China | Information Technology |
| 134 | Eisai Co Ltd | Japan | Health Care |
| 135 | Eli Lilly and Co | United States of America | Health Care |
| 136 | Giant Manufacturing Co Ltd | Taiwan | Consumer Discretionary |
| 137 | Adani Green Energy Ltd | India | Utilities |
| 138 | Pandora A/S | Denmark | Consumer Discretionary |
| 139 | EVE Energy Co., Ltd. | China | Industrials |
| 140 | Shanying International Holdings Co Ltd | China | Materials |
| 141 | voestalpine AG | Austria | Materials |
| 142 | Rivian Automotive, Inc. | United States of America | Consumer Discretionary |
| 143 | Sims Ltd | Australia | Materials |
| 144 | Suzlon Energy Ltd | India | Industrials |
| 145 | Acer Inc | Taiwan | Information Technology |
| 146 | Norsk Hydro ASA | Norway | Materials |
| 147 | Corning Inc | United States of America | Information Technology |
| 148 | Interconnection Electric SA ESP | Colombia | Utilities |
| 149 | Novonesis A/S | Denmark | Materials |
| 150 | Companhia de Saneamento Basico do Estado de Sao Paulo SABESP | Brazil | Utilities |
| 151 | MLS Co Ltd | China | Information Technology |
| 152 | Flat Glass Group Co., Ltd. | China | Information Technology |
| 153 | Siemens Ltd | India | Industrials |
| 154 | China Tower Corp Ltd | China | Communication Services |
| 155 | Canadian Pacific Kansas City Limited | Canada | Industrials |
| 156 | Zhejiang Leapmotor Technology Co., Ltd. | China | Consumer Discretionary |
| 157 | First Solar Inc | United States of America | Information Technology |
| 158 | Kurita Water Industries Ltd | Japan | Industrials |
| 159 | Greif Inc | United States of America | Materials |
| 160 | Sekisui Chemical Co Ltd | Japan | Consumer Discretionary |
| 161 | Ferrovial SA | Spain | Industrials |
| 162 | Engie Brasil Energia SA | Brazil | Utilities |
| 163 | Merck KGaA | Germany | Health Care |
| 164 | NKT A/S | Denmark | Industrials |
| 165 | Darling Ingredients Inc | United States of America | Consumer Staples |
| 166 | Olympus Corp | Japan | Health Care |
| 167 | Xinyi Solar Holdings Ltd | China | Information Technology |
| 168 | Waste Connections Inc | Canada | Industrials |
| 169 | Knorr Bremse AG | Germany | Industrials |
| 170 | Celestica Inc | Canada | Information Technology |
| 171 | China Railway Signal & Communication Corp Ltd | China | Information Technology |
| 172 | Taiwan High Speed Rail Corp | Taiwan | Industrials |
| 173 | EDP Renovaveis SA | Spain | Utilities |
| 174 | Astellas Pharma Inc | Japan | Health Care |
| 175 | Shimano Inc | Japan | Consumer Discretionary |
| 176 | BT Group PLC | United Kingdom | Communication Services |
| 177 | Amgen Inc | United States of America | Health Care |
| 178 | Stantec Inc | Canada | Industrials |
| 179 | Ecopro BM. Co., Ltd. | South Korea | Industrials |
| 180 | Puma SE | Germany | Consumer Discretionary |
| 181 | Clean Harbors Inc | United States of America | Industrials |
| 182 | Unibail-Rodamco-Westfield SE | France | Real Estate |
| 183 | Andritz AG | Austria | Industrials |
| 184 | Cascades Inc | Canada | Materials |
| 185 | SK Telecom Co Ltd | South Korea | Communication Services |
| 186 | GFL Environmental Inc | Canada | Industrials |
| 187 | Swatch Group AG | Switzerland | Consumer Discretionary |
| 188 | Power Grid Corporation of India Ltd | India | Utilities |
| 189 | Kimberly-Clark Corp | United States of America | Consumer Staples |
| 190 | Tung Ho Steel Enterprise Corp | Taiwan | Materials |
| 191 | Sonoco Products Co | United States of America | Materials |
| 192 | Longchen Paper & Packaging Co Ltd | Taiwan | Materials |
| 193 | SSAB AB | Sweden | Materials |
| 194 | Veralto Corp | United States of America | Industrials |
| 195 | Xerox Holdings Corp | United States of America | Information Technology |
| 196 | Posco Chemical Co Ltd | South Korea | Industrials |
| 197 | Meridian Energy Ltd | New Zealand | Utilities |
| 198 | Kimberly-Clark de Mexico SAB de CV | Mexico | Consumer Staples |
| 199 | Albemarle Corp | United States of America | Materials |
| 200 | Cheng Loong Corp | Taiwan | Materials |

Clean200 2026 Update: Investing in a Clean Energy Future by Michael Yow, Matthew Malinsky, Toby Heaps, Andrew Montes, and Andrew Behar is licensed under a Creative Commons Attribution 4.0 International License.
Based on a work at https://www.asyousow.org/report-page/2026-clean200-investing-in-a-clean-energy-future