
THE100
MOST
OVERPAID
CEOs
Are Fund Managers
Asleep at the Wheel?
KEY TAKEAWAYS
Total pay for S&P 500 chief executives continues to increase. Multiple studies analyzing pay in a variety of ways come to the same conclusion: CEO pay continues to rise sharply. The average pay of the S&P 500 CEOs in this report was $18,834,100 up 20.9 percent from last year’s average of $15,576,176. The average pay of the 100 Most Overpaid CEOs for this report was $38,192,249, up 30.6 percent from last year’s average of $29,233,020. The median pay for the 100 Most Overpaid CEOs – less influenced by the massive stock awards that inflate pay at the very top – was $23,455,188 representing an increase of 8 percent over the prior year. Mega-grants meant the highest CEO pay packages were higher than ever, with multiple packages with a grant date value over $200 million. Pay in the form of annual bonuses also increased substantially with a 39.3 percent increase over 2020.
The gap between CEO and median worker pay has also increased. According to the AFL-CIO, the chief executives of S&P 500 companies received an average of 324 times that of their median-paid workers, up from 299 times in 2020 and 264 times in 2019. At Amazon, the CEO to worker pay ratio reached 6,474 to 1, with CEO Andy Jassy making $212.7 million in total compensation while the median worker received $32,855.
Shareholder opposition to CEO pay packages continues to grow. Across multiple measures, shareholder rejection of pay packages continues to increase. In the S&P 500, shareholder votes against CEO pay continued its five-year upward trajectory to a high of 12.6 percent opposition, gaining 4.2 percentage points in votes against since 2017. As detailed in this report, more financial managers are voting against more pay packages. If it weren’t for the continued weak response from a handful of the big players, the message that shareholders are fed up would be clearer.
Companies with overpaid CEOs continue to underperform. For the past 8 reports since 2015, except for the 2018 report, the aggregate of the Most Overpaid 100 lagged the S&P 500 in total financial returns plus reinvested dividends. As a group, Overpaid CEOs have not delivered the expected financial results for the company based on their exorbitant pay. Even more compelling, in all eight years of these reports, the collection of firms with the 10 Most Overpaid CEOs suffered shareholder returns much worse than the Most Overpaid 100 and the S&P 500 index.
Votes on CEO pay are an effective tool when enough investors use their power and vote against. In this year’s report, we list some recent examples of reduced CEO pay packages following shareholder opposition to the CEO pay package.
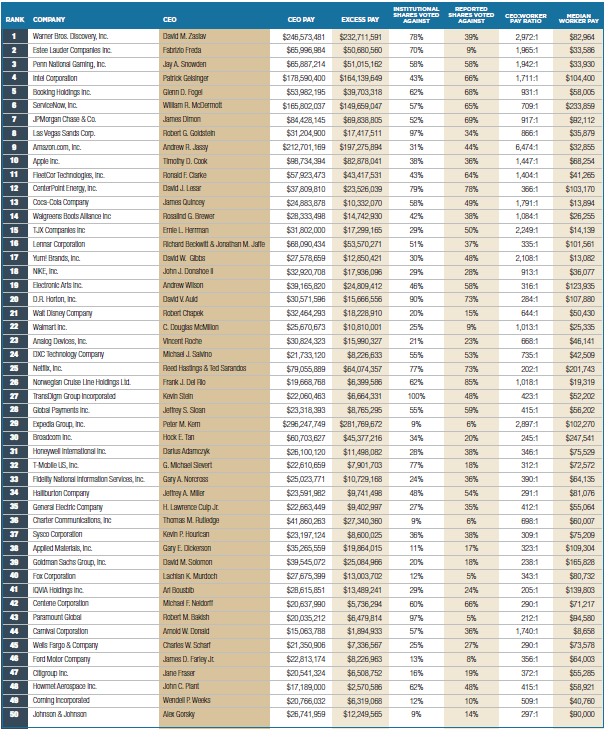
The top 25 Most Overpaid CEOs identified by As You Sow are listed in Figure 1. Most of these companies have appeared on our overpaid list in prior years, but this is the first appearance for the CEOs of Amazon, Analog Devices, Apple, and CenterPoint Energy. In addition, one of the companies on the top 25 list, Penn Entertainment, was recently removed from the S&P 500 list.
Figure 1 - The 25 Most Overpaid CEOs |
||||||||
| Rank | Company | CEO | CEO Pay | Excess Pay | REPORTED SHARES VOTED AGAINST | INSTITUTIONAL SHARES VOTED AGAINST | CEO:Worker Pay Ratio | Median Worker Pay |
|---|---|---|---|---|---|---|---|---|
| 1 | Warner Bros. Discovery, Inc. | David M. Zaslav | $246,573,481 | $232,711,591 | 39% | 78% | 2972:1 | $82,964 |
| 2 | Estee Lauder Companies Inc. | Fabrizio Freda | $65,996,984 | $50,680,560 | 9% | 70% | 1965:1 | $33,586 |
| 3 | Penn National Gaming, Inc. | Jay A. Snowden | $65,887,214 | $51,015,162 | 58% | 58% | 1942:1 | $33,930 |
| 4 | Intel Corporation | Patrick Gelsinger | $178,590,400 | $164,139,649 | 66% | 43% | 1711:1 | $104,400 |
| 5 | Booking Holdings Inc. | Glenn D. Fogel | $53,982,195 | $39,703,318 | 68% | 62% | 931:1 | $58,005 |
| 6 | ServiceNow, Inc. | William R. McDermott | $165,802,037 | $149,659,047 | 65% | 57% | 709:1 | $233,859 |
| 7 | Las Vegas Sands Corp. | Robert G. Goldstein | $31,204,900 | $17,417,511 | 34% | 97% | 866:1 | $35,879 |
| 8 | JPMorgan Chase & Co. | James Dimon | $84,428,145 | $69,838,805 | 69% | 52% | 917:1 | $92,112 |
| 9 | Amazon.com, Inc. | Andrew R. Jassy | $212,701,169 | $197,275,894 | 44% | 31% | 6474:1 | $32,855 |
| 10 | Apple Inc. | Timothy D. Cook | $98,734,394 | $82,878,041 | 36% | 38% | 1447:1 | $68,254 |
| 11 | FleetCor Technologies, Inc. | Ronald F. Clarke | $57,923,473 | $43,417,531 | 64% | 43% | 1404:1 | $41,265 |
| 12 | CenterPoint Energy, Inc. | David J. Lesar | $37,809,810 | $23,526,039 | 78% | 79% | 366:1 | $103,170 |
| 13 | Coca-Cola Company | James Quincey | $24,883,878 | $10,332,070 | 49% | 58% | 1791:1 | $13,894 |
| 14 | Walgreens Boots Alliance Inc | Rosalind G. Brewer | $28,333,498 | $14,742,930 | 38% | 42% | 1084:1 | $26,255 |
| 15 | TJX Companies Inc | Ernie L. Herrman | $31,802,000 | $17,299,165 | 50% | 29% | 2249:1 | $14,139 |
| 16 | Lennar Corporation | Richard Beckwitt Jonathan M. Jaffe |
$68,090,434 | $53,570,271 | 37% | 51% | 335:1 | $101,561 |
| 17 | Yum! Brands, Inc. | David W. Gibbs | $27,578,659 | $12,850,421 | 48% | 30% | 2108:1 | $13,082 |
| 18 | NIKE, Inc. | John J. Donahoe II | $32,920,708 | $17,936,096 | 28% | 29% | 913:1 | $36,077 |
| 19 | D.R. Horton, Inc. | David V. Auld | $30,571,596 | $15,666,556 | 73% | 90% | 284:1 | $107,880 |
| 20 | Electronic Arts Inc. | Andrew Wilson | $39,165,820 | $24,809,412 | 58% | 46% | 316:1 | $123,935 |
| 21 | Walt Disney Company | Robert Chapek | $32,464,293 | $18,228,910 | 15% | 20% | 644:1 | $50,430 |
| 22 | Walmart Inc. | C. Douglas McMillon | $25,670,673 | $10,810,001 | 9% | 25% | 1,013:1 | $25,335 |
| 23 | Analog Devices, Inc. | Vincent Roche | $30,824,323 | $15,990,327 | 23% | 21% | 668:1 | $46,141 |
| 24 | DXC Technology Company | Michael J. Salvino | $21,733,120 | $8,226,633 | 53% | 55% | 735:1 | $42,509 |
| 25 | Netflix, Inc. | Reed Hastings & Ted Sarandos |
$79,055,889 | $64,074,357 | 77% | 73% | 202:1 | $201,743 |

This report has a strong focus on financial manager voting, which is disclosed on an annual basis. The pay packages evaluated were those voted on in the year prior to June 30, 2022. Thus, some CEOs presented here and in Appendix A no longer hold those CEO positions, and others have held an annual meeting and pay vote since the one covered in this report.
Introduction
For the past nine years, As You Sow has issued a report identifying the 100 Most Overpaid CEOs among the companies in the S&P 500 index and analyzed the voting practices of large financial managers, mutual funds, and pension funds.
Shareholder votes on CEO pay packages provide a critical and underutilized tool for restraining the worst excesses. In this year’s report, we look at some of the reasons we believe the tool can be effective. This includes a review of several companies that addressed flaws and/or reduced total CEO compensation in a year following a high number of votes against pay packages.
While CEO pay continues to climb, workers pay has not increased at anywhere near the same pace. The SEC requires companies to disclose the pay ratio between the CEO of each specific company and the pay of the median worker (the employee with exactly half of other employees earning more and half of the other employees at the company earning less). In 1965, the CEO to median worker ratio was 20 to 1. By 1989 it was 59 to 1. The most recent Institute for Policy Studies (IPS) annual Executive Excess report found that the average CEO earned 670 times the annual pay of the median worker in 2021 at the largest 300 publicly traded companies.¹
Thus, some CEOs can receive a payment in one year that it would take one of their own employees 670 years, or even more, to make. This is a major factor in the increase in U.S. economic inequality in recent years. As You Sow includes this pay ratio as one of the factors used to identify the Most Overpaid CEOs list.
CEO COMPENSATION
Every S&P 500 company files a proxy statement with the SEC describing in detail its CEO’s pay package. The compensation report in the proxy statement often claims the pay package is based on the pay of similar, or peer, companies and the pay is tied to the performance of the company and its CEO. These explanations can run to 30 pages or more, detailing numerous metrics for both short term and long term bonuses which are all supposedly related to performance. Many academics have studied how the annual ratcheting up of the pay of all CEOs is not linked to performance. See in particular Pay without Performance by Harvard's Lucian Bebchuk and Jesse Fried or The CEO Pay Machine by Steven Clifford². As shown in Appendix F, there is almost no positive link between the pay of the CEO and the company's financial performance.
There are two main ways to measure CEO pay: grant date pay or realized pay. Grant date pay is reported in the proxy statement in its Summary Compensation Table (SCT). As You Sow uses grant date pay in this report. This method values stock granted to a CEO as part of pay at its market price at the time the grant is awarded or announced.
However, generally the stock vests either over time or after meeting performance metrics or both. Typically, several years pass before the CEO can sell the stock and turn this part of pay into cash. At that time its cash value may be more or less than it was when it was awarded or announced. Thus, the CEO will likely realize an amount that is different from that reported in the proxy statement. Similarly, the value of any stock options granted to the CEO will differ from the value placed on them when initially granted.
The realized pay method values stock and options given to the CEO at the cash value when they are sold or vested (when the CEO has the right to sell them). The realized pay method has historically been less visible and more difficult to calculate, but inclusion will be required in future proxy statements. Because of the extended bull market most CEO pay stock awards have come to be worth much more than they were originally estimated to be.
Recently the Economic Policy Institute (EPI) conducted a study of CEO pay at the top 350 firms in the United States using both the grant date and realized pay method. EPI found the average CEO in the 350 firms was paid $15.6 million per year when measured using the grant date method and $27.8 million per year when using the realized date method. Realized CEO pay in the 350 companies they analyzed rose by an average of $2.8 million or 11.1 percent while grant date pay increased 9.6 percent from from 2020 to 2021.³ In other words, the grant date method of valuing CEO pay greatly understates the amount of money that the CEO actually collects for work as a CEO.⁴
Insightia, a data analysis firm, using a different set of companies and a different time frame, found that realized pay for the CEOs of S&P 500 companies averaged an incredible $65 million per year in 2021.⁵
The AFL-CIO's Paywatch website uses grant date to measure pay and has a slightly different time frame than we do, but reports that CEO pay increased in 2021 by an average of 18.2 percent. They note that this is greater than the inflation rate of 7.1 percent during that time frame, and much greater than the 4.7 percent increase in worker wages during that same time frame.⁶
A WTW (rebranded name from Willis Towers Watson) analysis – that reported only on companies that had filed proxies by the end of April 2022 - found that the pay increase in 2021 was the highest since 2014. According to the analysis, “total pay for CEOs at large publicly traded companies jumped 15.7 percent in 2021, sharply higher than the 3.2 percent median increase in 2020.” ⁷ Higher annual bonuses were a major component of high annual pay with annual bonuses ballooning by 39.3 percent, compared to a decline of 6.1 percent in 2020. A very high proportion of CEOs were paid above target bonus with 82 percent of the CEOs in this analysis receiving bonuses of more than 100 percent of target.⁸ This suggests a systemic easing of target criteria.
On May 15, 2022, The Wall Street Journal published figures on CEO pay showing an increase for all S&P 500 companies. Using that data, As You Sow found there were 137 companies (27 percent of the S&P 500 companies) where CEO pay increased by more than 30 percent over the prior year and 28 companies (five percent of S&P 500 companies) where CEO pay increased by more than 100 percent.⁹
There are many ways to measure CEO pay, but looking at pay data from 2021, there was a consistent conclusion: CEO pay was up, often sharply. The rate of increase was among the highest in recent years.
Comparing the Pay of American CEOs to Global Competitors
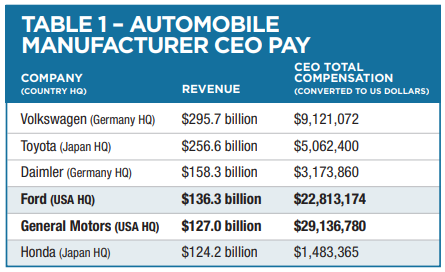
In 2019 WTW analyzed non-U.S. and U.S.-based public companies with sale revenues over $10 billion a year and reported median pay. The median CEO pay in the U.S. was $14.5 million per year. CEOs in Germany or the UK were awarded about half of that; $6.94 million and $6.15 million respectively. CEOs in France were awarded about a third of the median U.S. CEO pay, $5.04 million, and CEOs in Japan were awarded about one fifth of the median U.S. CEO Pay at $1.89 million.
Using the example of the automobile industry, and considering CEO pay across the globe supports the case that the exorbitant pay that U.S. CEOs are awarded does not fully reflect financial performance. Table 1 lists automobile manufacturer CEO pay (converted to U.S. Dollars) from highest to lowest company revenue. Compensation for the CEOs of Ford and General Motors was significantly higher than their non-U.S. counterparts.
Case Study
ELON MUSK AT TESLA
Equity is granted under the theory that it aligns the executive’s interests with that of shareholders to focus on shared future prosperity. There is no better proof of the hollowness of this argument than Elon Musk, whose record-breaking awards at Tesla appear to have done the opposite. Instead of causing Musk to share the perspective of Tesla shareholders more closely, the awards financed his purchase of Twitter and his near-continuous alienation of Tesla customers and shareholders. His actions have undermined the confidence Tesla shareholders once placed in him. Tesla’s stock lost about 65% of its value in 2022. Not only has the compensation awarded to Elon Musk unaligned him from the other shareholders, but it has also ultimately contributed to a significant loss for Tesla shareholders.
Even before the Twitter purchase, Tesla directors faced a shareholder lawsuit in the Chancery Court filed in Delaware alleging that Musk’s 2018 compensation – with a grant date value of $2.6 billion and a value the plaintiffs estimate could reach $55 billion – represented a breach of fiduciary duty and waste. Musk himself faces a claim of “unjust enrichment.” The shareholder plaintiffs described the plan as “approved by a conflicted Committee and supine Board."10
The case was heard in November 2022, and the Delaware court is expected to rule on the case in the coming months.
HOW WE IDENTIFY THE 100 MOST OVERPAID CEOS
We use three rankings of the entire S&P 500 to identify the 100 that are the most overpaid.
These are:
1. HIP Investor runs a statistical regression analysis for us of the financial performance of each current S&P 500 company’s five-year total returns and reported CEO Pay. ESGAUGE provided CEO compensation data and HIP Investor compared it with Total Shareholder Return (TSR) – total stock gains or losses, plus reinvested dividends. From this analysis HIP Investor computed the amount the CEO would be expected to be paid in the current year, given its latest multi-year TSR, and assuming that the pay reflects that higher or lower financial performance. If the actual pay given in the current year differs from that amount, we compute the difference and call it "excess pay" for the year. The companies are then ranked from 1 to 500, with the one with the CEO with the most excess pay at the top. Additional details of the regression analysis are given in Appendix C.
2. The second ranking identified the companies where the highest percentage of shares voted against the CEO pay package. This measure provides something of a consensus on company shareholders’ opinion. This is done with SEC form 13-F voting data provided by Insightia. The companies are then ranked from 1 to 500, with the one with the highest percentage of shares voting against the CEO pay package at the top.
3. The third ranking compares the pay of the CEO to the median employee. We use the CEO to median worker pay ratio, as reported by the company in its annual proxy statement, and mandated by the Dodd-Frank law. The companies are then ranked from 1 to 500, with the one with the highest CEO pay to median worker pay ratio at the top.
These three rankings are then combined into one summary ranking, weighting the first two (excess pay, percent of shares voted against) at 40 percent each, and the last one (CEO pay ratio) at 20 percent, to give us a single ranking to determine where the CEO's pay sits compared to the pay of all other CEOs in the S&P 500. The Most Overpaid 100 are listed in Appendix A.
In calculating the percentage of shareholder votes against the CEO’s pay package, As You Sow uses the votes of those shareholders who are required to file a 13-F form by the SEC. There are two reasons this figure provides a more accurate reflection of shareholders’ opinion than those reported by the company. First, some companies have multiple classes of stock, where shareholders of some classes get more votes per share than shareholders of other classes. The second reason is that the CEO, as well as other insiders, may control a significant number of shares. The SEC requires most institutional financial managers to report their votes in form 13-F, and Insightia provides us those votes. The figures for both measures of shareholder opposition to the CEO pay package can be found in Appendix B.
As an example of the difference between these ways of reporting, consider the case of Estee Lauder, the company with the second most overpaid CEO in this year's list of Overpaid CEOs. Estee Lauder has two classes of stock. Class B shares, controlled by the Lauder family, have ten times as many votes per share as the shares of ordinary investors. The company reported that overall 90.79 percent of all the share votes were in favor of the CEO's $66 million pay package. But if you look at the shares of institutional financial managers alone, as reported on form 13-F, you will see that 70 percent of those shares voted against the CEO's pay package.
VOTING ON CEO PAY
In 2010, as part of the Dodd-Frank financial reform bill, companies were required to allow shareholders to vote to approve or disapprove the CEO pay package at the annual meeting when they cast votes for board of directors.
Our original impetus for producing this report nearly a decade ago was our sense that (a) too many S&P 500 CEOs were being grossly overpaid and (b) too many financial managers were approving the pay packages of these grossly overpaid CEOs. Since then, we have seen an increase in the votes against these pay packages by shareholders and financial managers.
SHAREHOLDER VOTES SPUR CHANGES IN CEO PAY
When a significant number of shareholders vote against a company's CEO pay package, the company usually reaches out to them. In many cases the company makes changes in the CEO pay package for the following year; though many of those changes may not directly affect the total amount of pay. Many companies disclose information regarding those discussions and any changes made in the company's following annual proxy statement, where the CEO pay package for the following year is presented for a vote.
Increasingly, shareholders analyze this disclosure and decide whether the company has been sufficiently responsive to concerns raised. If not, some shareholders may vote against re-electing to the board compensation committee members as well as voting against the CEO pay package for a second time.
Below are some examples of companies where many shareholders voted against the CEO pay package and the CEO's pay package fell the following year.
Activision Blizzard, a video game developer and publisher, reported paying its CEO, Robert Kotick, $154 million in 2020 (1,560 times the amount the company paid its median employee). Despite the fact that the company’s one-year shareholder return in 2021 was negative 28 percent, Blackrock and Vanguard, who control 15.8 percent of the shares, voted to approve that CEO pay package. However, a total of 44.4 percent of the shares voted against it. Afterward, the company dropped the CEO’s pay to less than $1 million dollars the following year.
Amerisource Bergen, a drug distributor that lost $3.4 billion in 2020 as a result of losing a $6.6 billion dollar lawsuit relating to its distribution of opioid drugs, did not factor that loss into the financial performance measures used to determine the CEO's pay. Therefore the owners of 48 percent of its shares vote against the CEO's $14 million dollar 2020 pay package. The company then reduced the CEO's 2021 "short term incentive" bonus by $1.8 million.
Aptiv, formerly known as Delphi Automotive, makes software for self-driving cars. In 2020 the CEO’s pay package totaled $31 million dollars, 5,294 times the amount the company paid its median employee. Aptiv was 14th on our list of the 100 Most Overpaid CEOs. Vanguard and SSgA, who control 14.3 percent of the company’s shares, voted to approve its CEO pay package. However, a total of 42 percent of the company's shares voted against it. After that vote, the company reduced the CEO's pay package by more than half to $14 million dollars for the following year.
Ceridian, a payroll processing company, paid its CEO $32 million dollars in 2020. The owners of 73.9 percent of shares voted against that CEO pay package. After that vote, the company reduced the CEO’s pay for 2021 by 67 percent, to $10 million dollars.
Chipotle, a fast casual Mexican restaurant company, paid its CEO $38.3 million in 2020, 2,898 times what it paid its median worker. Chipotle’s CEO was 9th on the list of the 100 Most Overpaid CEOs. Blackrock, which controls 7 percent of the company’s shares, voted to approve that CEO pay package. However, in total, the owners of 48.6 percent of Chipotle shares voted against it. In the following year, 2021, the company reduced the pay of its CEO by 53 percent to $17.8 million.
Hilton, a hospitality company, paid its CEO $55 million in 2020, 1,953 times what it paid its median worker. Hilton’s CEO was sixth among the 100 Most Overpaid CEOs. BlackRock (owner of 6.7 percent of shares) voted for the $55 million dollar pay package (Vanguard and SSgA voted against it). In total, 43 percent of the shares voted against it. In the following year, 2021, the company decreased its CEO’s pay by 58 percent, to $23 million.
Paycom, a payroll processing company, reported paying its CEO $211 million in 2020, 2,963 times what it paid its median worker, and was listed in our report as the company with the most overpaid CEO among all the S&P 500 companies. The owners of 69.7 percent of its shares (including BlackRock, Vanguard, and SSgA) all voted against that CEO pay package. After that vote, the company reduced its CEO pay by 98 percent to $2.9 million for the following year.
Prologis, a Real Estate Investment Trust that builds and owns warehouses (that are then leased out to others) and has fewer than 2,000 employees, reported that in 2020 it paid its CEO $34 million dollars (330 times the $104,000 that it paid its median employee). The owners of 48 percent of its shares objected and voted against that CEO pay package, and in 2021, the company reduced the CEO's pay by 26 percent, to $24.9 million dollars, and at the same time, the company raised the pay of its median employee by 10 percent to $114,000, resulting in a CEO to median worker pay ratio that now is 218:1.
PROXY ADVISORS AND VOTING OPTIONS
Financial managers often rely on proxy advisors to evaluate CEO pay packages. The two largest proxy advisors are Institutional Shareholder Services (ISS) and Glass Lewis. Others include Egan-Jones, Segal Marco, Pensions and Investments Research Consultants (PIRC), Groupe Investissement Responsible (GIR), and Federated Hermes.
Each of these proxy advisors does an extremely detailed analysis of the CEO pay package at every S&P 500 company and then recommends a vote to approve or disapprove the package based based on this analysis. The largest proxy advisors also offer custom-designed policies as well as other policies in addition to the standard analysis. For example, Glass Lewis has seven thematic policies in addition to its standard policy. In 2022, Glass Lewis recommended voting against 14.5 percent of the CEO pay packages at S&P 500 companies and against 54 percent of the 100 Most Overpaid CEOs in its standard policy. The ESG Policy recommended against 59.4 percent of the 100 Most Overpaid CEOs and the public pension policy recommended against 58.4 percent. The policy that recommended against the highest number of Overpaid CEOs was the climate policy with votes against 68.1 percent, largely because it votes against compensation packages if they do not include environmental or social criteria.
The standard policy of ISS typically recommends voting against approximately 11 percent of the CEO pay at S&P 500 companies and against 45 percent of the 100 Most Overpaid CEOs. We estimate ISS’s SRI policy voted against approximately 20 percent of the S&P 500 and almost half of the Most Overpaid CEOs. Historically ISS’s public pension fund and Taft-Hartley polices usually recommend voting against about twice as many CEO pay packages as the standard policy.
Segal Marco’s standard policy recommended voting against 61.6 percent of the 100 Most Overpaid CEOs. Egan Jones recommended voting against 70 percent of the CEO pay packages of the 100 Most Overpaid CEOs while GIR recommended voting against still more, with a recommendation against 93 percent of pay packages of the 100 Most Overpaid CEOs. PIRC recommended voting against 81 percent of companies on the 100 Most Overpaid CEOs list and abstained from a vote recommendation on 18 companies on the list.
Broadridge ProxyEdge offers a policy developed by As You Sow that votes against CEO pay packages that pay the CEO more than 100 times what the company pays its median worker and also those that pay the CEO substantially higher than their peers. This policy resulted in votes against all of the CEO pay packages on the 100 Most Overpaid list and close to 70 percent of the CEO pay packages at S&P 500 companies.
RESULTS OF SHAREHOLDER VOTES ON CEO PAY
Each year there are more shareholder votes against CEO pay packages. In 2020 the average percent of votes against the CEO pay packages at the S&P 500 companies was 10.4 percent. In 2021 average opposition rose to 11.7 percent and in 2022 average opposition increased to 12.6 percent against. This represents a generally consistent increase in votes against CEO pay each year.
In our last report, sixteen of the S&P 500 companies had more than 50 percent of their shareholders vote against the CEO pay package. This year there was a 25 percent increase in that figure, as 21 companies saw at least 50 percent of their shares reject the pay package of the CEO. When considering just the shares controlled by institutional financial managers, almost twice as many; 33 of the S&P 500 companies had more than 50 percent of these shares reject the CEO pay package.
If we consider a lower threshold of 30 percent of company shares rejecting the CEO pay package, approximately half of the 100 Most Overpaid had rejected CEO pay packages.
VOTING PRACTICES OF INDIVIDUAL FINANCIAL FUND MANAGERS
HSBC, an international bank and financial manager headquartered in London, is the largest bank in Europe by total assets. HSBC Asset Management voted against 95 percent of pay packages from the 100 Most Overpaid CEOs list, an increase from 72.5 percent last year. Opposition against CEO pay plans at the S&P 500 also increased. HSBC adopted a new Stewardship and Engagement Plan in January of 2022 and new voting guidelines in June 2022. The voting guidelines includes, as several European guidelines do, a section on quantum of pay which notes, “We are increasingly mindful of the impact high executive pay has on economic inequality and social cohesion, and therefore will vote against pay outcomes that do not meet our framework for fair executive pay.” Elsewhere on the website, HSBC framework is described as “allow[ing] the CEO to earn between 20 and 170 times the national median wage in the United States and the United Kingdom.” The fund adds that it will “scrutinize corporate pay policy individually and with nuance.”¹¹
By way of contrast, BlackRock, the largest U.S.-based financial fund manager, voted against only 5.7 percent of the S&P 500 CEO pay packages in 2022. However, this represents an increase in against votes from last year when they voted against only 4.2 percent of pay packages. In the case of CEO pay packages of the 100 Most Overpaid CEOs, BlackRock voted against 25 percent of them.

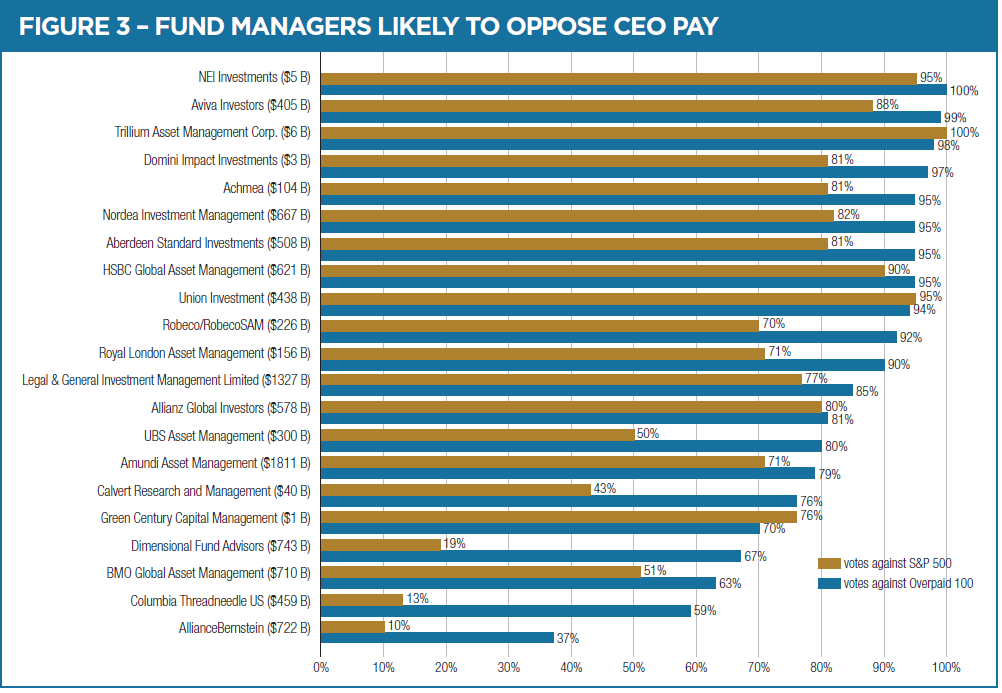
The next biggest U.S.-based financial manager, Vanguard, voted against only 4.8 percent of CEO pay packages at S&P 500 companies in 2022. This is about a 15 percent differential over the 4.2 percent they voted against in 2021. In the case of CEO pay packages of the 100 Most Overpaid CEOs, Vanguard voted against 26 percent of them.
Another large U.S.-based financial manager is State Street Global Advisors (SSgA). SSgA sometimes abstains from voting on a CEO pay package that they find unacceptable. In 2022 they abstained or voted against 9.6 percent of the S&P 500 CEO pay packages, a slight improvement over their 2021 record of voting against or abstaining from 9.1 percent of S&P 500 pay packages. In the case of CEO pay packages of the 100 Most Overpaid CEOs, SSgA abstained or voted against 36 percent of them.
When As You Sow did additional analysis of who voted yes on pay packages that most other shareholders voted against, SSgA came up a surprising number of times. They voted yes on pay at several companies where the majority of shareholders voted no. This included at least four companies where ISS and Glass Lewis both recommended no votes, and where BlackRock and Vanguard voted against. For example, in 2022, 84.6 percent of shareholders voted against the CEO’s pay package at Norwegian Cruise Lines, yet SSgA voted to approve it.
PUBLIC PENSION FUNDS DELEGATE THEIR VOTING TO FINANCIAL MANAGERS
Some pension funds vote their shares themselves, typically using one or more of the proxy advisory services. The votes of some of those funds will be described in the next section. Other pension funds delegate their voting to the financial managers they employ. Most often employed in this manner are BlackRock and State Street. In the table below, we list some of the pension funds that delegate all or part of their voting to those two financial managers.
| BLACKROCK | SSgA (STATE STREET) |
|---|---|
| City of Fresno Employee Retirement System | Alaska Retirement Management Board |
| Employees Retirement System of the State of Hawaii | Arizona Public Safety Personnel Retirement System |
| Iowa Public Employees Retirement System (IPERS) | District of Columbia Retirement Board |
| Kansas Public Employees Retirement System | Fresno County Employees Retirement Association |
| Nebraska Public Employees Retirement Systems | Kansas Public Employees Retirement System |
| Nevada Public Employees Retirement System | Metropolitan Water Reclamation District Retirement Fund |
| Public Employees Retirement System of New Mexico | Nebraska Public Employees Retirement Systems |
| San Diego County Employees Retirement Association | Oklahoma Public Employees Retirement System |
| Texas Education Agency | Oklahoma Teachers’ Retirement System |
| Public Employees Retirement System of Mississippi | Public Employees Retirement System of New Mexico |
| University of Texas Investment Management Company (UTIMCO) | San Diego County Employees Retirement Association |
| Tennessee Consolidated Retirement System (TCRS) | |
| Texas Municipal Retirement System | |
| The Public Employees Retirement System of Mississippi | |
| West Virginia Investment Management Board |

VOTING PRACTICES OF PUBLIC PENSION FUNDS
The University of California Pension Fund and Endowment - $126 Billion AUM
The President of the University as a whole manages funds to pay for both the pensions of University employees and $18 Billion of the University's endowment. Additional endowment funds are managed elsewhere. Using the services of a custom-designed ISS policy, the University voted against the CEO pay packages of 83 percent of the S&P 500 companies and 90% of the Overpaid 100. The University, using the services of ISS, publicizes its votes at each of the companies it invests in as well as summary statistics about its voting record. For each CEO pay package that they vote against, they provide a reason. One reason the University may cite is that the company is comparing the pay of its CEO to a group of companies, half of which are at least 1.5 times bigger than it is.
For example, ISS posts for the University the following reason why it voted against Apple CEO Tim Cook's latest pay package:
The percentage of the CEO's performance-based equity pay (LTIP) is less than 70%. A vote AGAINST this proposal is warranted due to concerns around equity award design and pay magnitude. While the CEO's FY21 equity award marked his first LTI award since his mega award ten years ago, half of the $75 million award is purely time-based, and the award would continue to vest in full in the event of his retirement. Further, the company does not disclose that the award is intended to cover multiple years of future awards, despite its large size, and CEO Cook received another sizable grant of equity after the end of the fiscal year. In addition, notwithstanding that Apple is the largest company in its peer group, other NEOs consistently receive equity awards with values that approach the median total CEO pay of peers, and CEO Cook's relatively high base salary contributes to significant STI payout opportunities.¹²

California Public Employees' Retirement System (CalPERS) -- $499 Billion AUM
CalPERS voted against 46 percent of the S&P 500 CEO pay packages, a slight increase over the 44 percent it voted against last year. For the Overpaid 100 this year, 79 percent were voted against, compared to 76 percent voted against last year.
California State Teachers Retirement System (CalSTRS) -- $320 Billion AUM
CalSTRS voted against 28 percent of the S&P 500 CEO pay packages, a decrease from the 35 percent it voted against last year. For the Overpaid 100, this year, 71 percent were voted against, compared to 69 percent voted against last year.
New York City Employees Retirement System -- $211 Billion AUM
The New York City Pension Funds voted against 36 percent of the S&P 500 CEO pay packages, an increase from the 32 percent that it voted against last year. For the Overpaid 100 this year, 83 percent were voted against, compared to the 78 percent voted against last year. The Comptroller of the City of New York highlighted concerns with the CEO pay package at Amazon in a campaign to urge shareholders to vote against two Compensation Committee directors at due to concerns regarding the company’s human capital management. Specifically, the fund noted Amazon granted, "the company's five highest-paid executives approximately $400 million in compensation in 2021, including $212 million in time-vested restricted stock to new CEO Andrew Jassy, exacerbating our concerns about where the Committee's priorities lie. Amazon's 6,474 to 1 CEO to median compensated employee confirms these concerns."¹³
New York State Common Retirement Fund -- $211 Billion AUM
The New York State Retirement fund voted against 35 percent of the S&P 500 CEO pay packages in 2022, a decrease from the 42 percent it voted against last year. For the Overpaid 100, this year 77 percent were voted against, same as the 77 percent voted against last year.
Florida State Board of Administration (FSBA) -- $206 Billion AUM
FSBA manages the pension funds for the employees and retirees of the State of Florida. It voted against 57 percent of the S&P 500 CEO pay packages, a significant decrease from the 70 percent it voted against last year. For the Overpaid 100 list, this year 88 percent were voted against, compared to 91 percent voted against last year.
Massachusetts Pension Reserves Investment Management (PRIM) -- $78 Billion AUM
PRIM voted against 33 percent of the CEO pay packages of the S&P500 companies, an increase from the 27 percent it voted against last year. For the Overpaid 100, this year 69 percent were voted against, compared to 65 percent voted against last year.
Rhode Island Office of the General Treasurer -- $8 Billion AUM
The Treasurer's Office manages the pension funds for the state of Rhode Island and voted against 55 percent of the S&P 500 CEO pay packages, up slightly from the 54 percent it voted against last year. For the Overpaid 100, this year 77 percent were voted against, compared to 79 percent voted against last year.

ADDITIONAL CASE STUDIES
Case Study
AMAZON
Andrew Jassy, who was promoted to replace founder Jeff Bezos as CEO in July 2021, had total compensation of $212,701,169 for fiscal 2021. Amazon is ranked 9th on our overpaid list this year, its first appearance on the list. Jassy, who has been with Amazon for the last 25 years most recently as CEO of Amazon Web Services received $55 million in stock awards in 2018 and 2020. He owns 94,729 shares of the company. In its proxy statement Amazon noted that for the past three years the average realized pay of “CEOs of Alphabet, Apple, and Microsoft, and for the COO of Meta, ranged from $151 million a year to $220 million a year.” On the one hand Amazon suggests that shareholders consider the $214 million award as part of a ten year pay package. The references to these CEOs and their realized pay (i.e. cash plus what they received from the sale of shares and/or vesting or exercising of options) suggests shareholders should expect more large awards going forward.
The Comptroller of the City of New York urged shareholders to vote against two Compensation Committee directors due to concerns regarding the company's human capital management. In a supplemental filing with the SEC in April they specifically note, “The Committee's decision to grant the company’s five highest paid executives approximately $400 million in compensation in 2021, including $212 million in time-vested restricted stock to new CEO Andrew Jassy, exacerbates our concerns about where the Committee’s priorities lie. Amazon’s 6,474-to-1 CEO-to-median compensated employee ratio confirms these concerns.”
BlackRock and SSgA voted for the CEO pay, most shareholders voted against. This is another case where looking at the 13-F compared to the reported vote is interesting. Insightia found that only 37.95 percent of 13-F shareholders voted for the CEO pay. Amazon reported to the SEC that 56.01 percent of shares were cast for CEO pay. The difference? Most likely insiders who not surprisingly almost universally vote for pay. According to the proxy statement, founder Jeff Bezos owns 12.7 percent of the stock.
CASE STUDIES
INTEL
CEO Pattrick Gelsinger, who re-joined Intel in February 2021, had one of the highest reported total compensation packages this year: $178,590,400. If the amount he was given was related to the company's previous financial performance, HIP Investor calculates that the amount would be much lower at $14.5 million. Thus, HIP Investor deems his excess pay to be over $164 million. It should be noted that at the 2021 annual shareholder meeting, when the CEO was Robert Swan, Intel was ranked as the company with the 36th Most Overpaid CEO on our list. This was based on Swan's pay of $22 million in that year. At that meeting, 62 percent of Intel's shares voted against that pay package. This year Intel moves up in our list of companies with the most overpaid CEO to now be number five on the list, and the percentage of shares voting against his pay package has risen to 68.8 percent. Among those voting against it were both Blackrock and Vanguard who control 17 percent of the company's shares. SSgA voted to approve it.
CASE STUDIES
PENN NATIONAL GAMING
Penn Entertainment CEO Jay Snowden, number three on our list of overpaid CEOs, had compensation for fiscal year 2021 of $65,887,214. HIP Investor calculates that his expected pay was about $50 million more than it should have been. Snowden was paid more than five times what the other CEOs in his peer group were paid. Snowden’s pay package increased 1590 percent over the previous year while the 1 year TSR is down 40 percent. The median employee at the company, which owns, operates, and manages casinos, hotels, and racing facilities, had total compensation for 2021 of $33,930. As the proxy statement reports, Snowden’s compensation was 1,942 times the median pay for an employee that year.
The pay package was so high that the major financial managers -- BlackRock, Vanguard and SSgA -- were part of the 58 percent of shares that voted against CEO pay at the company’s June 7, 2022 meeting.
CONCLUSION
Multiple studies of CEO pay at S&P 500 companies come to the same conclusion. The pay is very, very high, and it is continuing to rise year after year. The totals are staggering. The total pay of all 500 CEOs in this group is $7.7 billion per year. Of this, about half, or $3.8 billion, goes to the 100 of them that are in our list of the 100 Most Overpaid CEOs. HIP calculates that this group of 100 people receive over $2 billion a year in excess pay.
As this goes on, more and more shareholders are objecting. The average vote against the CEO pay package at the S&P500 companies since 2017 has risen 4.2 percentage points, or 49 percent, from 8.6 percent against in 2017 to 12.8 percent against in 2022.
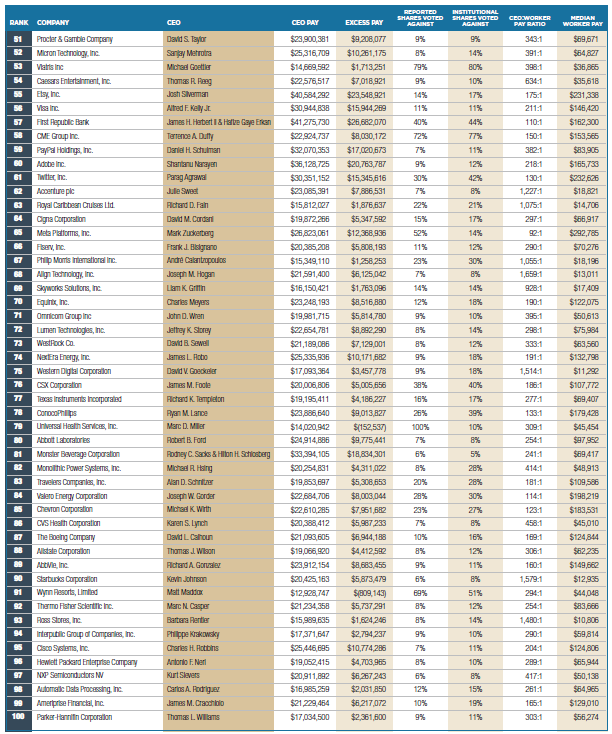
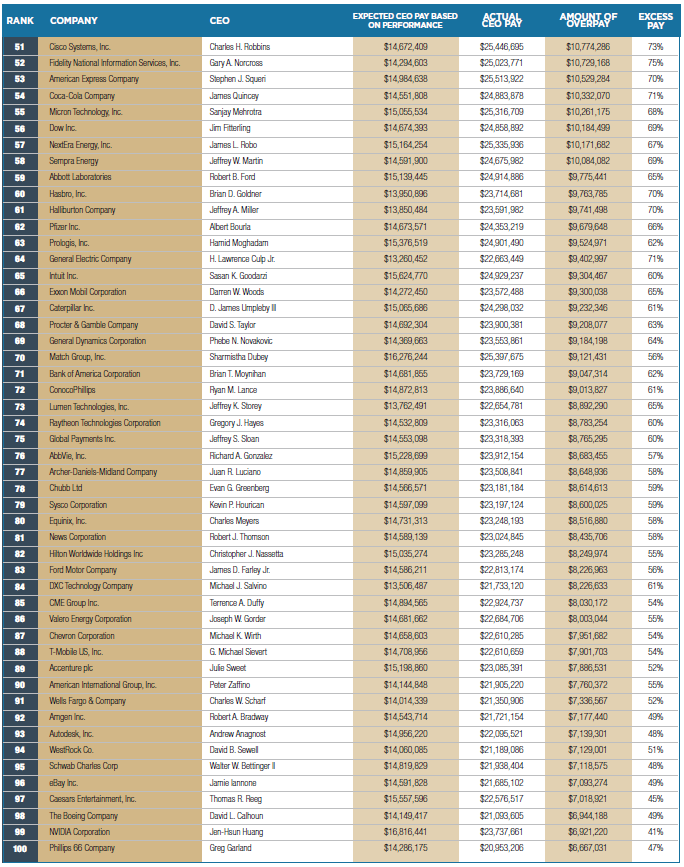
APPENDIX A – THE 100 MOST OVERPAID CEOs
| Rank | Company | CEO | CEO Pay | Excess Pay | Institutional Shares Voted Against | Reported Shares Voted Against | CEO:Worker Pay Ratio | Median Worker Pay |
|---|---|---|---|---|---|---|---|---|
| 1 | Warner Bros. Discovery, Inc. | David M. Zaslav | $246,573,481 | $232,711,591 | 78% | 39% | 2972:1 | $82,964 |
| 2 | Estee Lauder Companies Inc. | Fabrizio Freda | $65,996,984 | $50,680,560 | 70% | 9% | 1965:1 | $33,586 |
| 3 | Penn National Gaming, Inc. | Jay A. Snowden | $65,887,214 | $51,015,162 | 58% | 58% | 1942:1 | $33,930 |
| 4 | Intel Corporation | Patrick Gelsinger | $178,590,400 | $164,139,649 | 43% | 66% | 1711:1 | $104,400 |
| 5 | Booking Holdings Inc. | Glenn D. Fogel | $53,982,195 | $39,703,318 | 62% | 68% | 931:1 | $58,005 |
| 6 | ServiceNow, Inc. | William R. McDermott | $165,802,037 | $149,659,047 | 57% | 65% | 709:1 | $233,859 |
| 7 | JPMorgan Chase & Co. | James Dimon | $84,428,145 | $69,838,805 | 52% | 69% | 917:1 | $92,112 |
| 8 | Las Vegas Sands Corp. | Robert G. Goldstein | $31,204,900 | $17,417,511 | 97% | 34% | 866:1 | $35,879 |
| 9 | Amazon.com, Inc. | Andrew R. Jassy | $212,701,169 | $197,275,894 | 31% | 44% | 6474:1 | $32,855 |
| 10 | Apple Inc. | Timothy D. Cook | $98,734,394 | $82,878,041 | 38% | 36% | 1447:1 | 68,254 |
| 11 | FleetCor Technologies, Inc. | Ronald F. Clarke | $57,923,473 | $43,417,531 | 43% | 64% | 1404:1 | 41,265 |
| 12 | CenterPoint Energy, Inc. | David J. Lesar | $37,809,810 | $23,526,039 | 79% | 78% | 366:1 | 103,170 |
| 13 | Coca-Cola Company | James Quincey | $24,883,878 | $10,332,070 | 58% | 49% | 1791:1 | $13,894 |
| 14 | Walgreens Boots Alliance Inc | Rosalind G. Brewer | $28,333,498 | $14,742,930 | 42% | 38% | 1084:1 | $26,255 |
| 15 | TJX Companies Inc | Ernie L. Herrman | $31,802,000 | $17,299,165 | 29% | 50% | 2249:1 | $14,139 |
| 16 | Lennar Corporation | Richard Beckwitt & Jonathan M. Jaffe |
$68,090,434 | $53,570,271 | 51% | 37% | 335:1 | $101,561 |
| 17 | Yum! Brands, Inc. | David W. Gibbs | $27,578,659 | $12,850,421 | 30% | 48% | 2108:1 | $13,082 |
| 18 | NIKE, Inc. | John J. Donahoe II | $32,920,708 | $17,936,096 | 29% | 28% | 913:1 | $36,077 |
| 19 | Electronic Arts Inc. | Andrew Wilson | $39,165,820 | $24,809,412 | 46% | 58% | 316:1 | $123,935 |
| 20 | D.R. Horton, Inc. | David V. Auld | $30,571,596 | $15,666,556 | 90% | 73% | 284:1 | $107,880 |
| 21 | Walt Disney Company | Robert Chapek | $32,464,293 | $18,228,910 | 20% | 15% | 644:1 | $50,430 |
| 22 | Walmart Inc. | C. Douglas McMillon | $25,670,673 | $10,810,001 | 25% | 9% | 1013:1 | $25,335 |
| 23 | Analog Devices, Inc. | Vincent Roche | $30,824,323 | $15,990,327 | 21% | 23% | 668:1 | $46,141 |
| 24 | DXC Technology Company | Michael J. Salvino | $21,733,120 | $8,226,633 | 55% | 53% | 735:1 | $42,509 |
| 25 | Netflix, Inc. | Reed Hastings & Ted Sarandos |
$79,055,889 | $64,074,357 | 77% | 73% | 202:1 | $201,743 |
| 26 | Norwegian Cruise Line Holdings Ltd. | Frank J. Del Rio | $19,668,768 | $6,399,586 | 62% | 85% | 1018:1 | $19,319 |
| 27 | TransDigm Group Incorporated | Kevin Stein | $22,060,463 | $6,664,331 | 100% | 48% | 423:1 | $52,202 |
| 28 | Global Payments Inc. | Jeffrey S. Sloan | $23,318,393 | $8,765,295 | 55% | 59% | 415:1 | $56,202 |
| 29 | Expedia Group, Inc. | Peter M. Kern | $296,247,749 | $281,769,672 | 9% | 6% | 2897:1 | $102,270 |
| 30 | Broadcom Inc. | Hock E. Tan | $60,703,627 | $45,377,216 | 34% | 20% | 245:1 | $247,541 |
| 31 | Honeywell International Inc. | Darius Adamczyk | $26,100,120 | $11,498,082 | 28% | 38% | 346:1 | $75,529 |
| 32 | T-Mobile US, Inc. | G.Michael Sievert | $22,610,659 | $7,901,703 | 77% | 18% | 312:1 | $72,572 |
| 33 | Fidelity National Information Services, Inc. | Gary A. Norcross | $25,023,771 | $10,729,168 | 24% | 36% | 390:1 | $64,135 |
| 34 | Halliburton Company | Jeffrey A. Miller | $23,591,982 | $9,741,498 | 48% | 54% | 291:1 | $81,076 |
| 35 | General Electric Company | H. Lawrence Culp Jr. | $22,663,449 | $9,402,997 | 27% | 35% | 412:1 | $55,064 |
| 36 | Charter Communications, Inc | Thomas M. Rutledge | $41,860,263 | $27,340,360 | 9% | 6% | 698:1 | $60,007 |
| 37 | Sysco Corporation | Kevin P. Hourican | $23,197,124 | $8,600,025 | 36% | 38% | 309:1 | $75,209 |
| 38 | Applied Materials, Inc. | Gary E. Dickerson | $35,265,559 | $19,864,015 | 11% | 17% | 323:1 | $109,304 |
| 39 | Goldman Sachs Group, Inc. | David M. Solomon | $39,545,072 | $25,084,966 | 20% | 18% | 238:1 | $165,828 |
| 40 | Fox Corporation | Lachlan K. Murdoch | $27,675,399 | $13,003,702 | 12% | 5% | 343:1 | $80,732 |
| 41 | IQVIA Holdings Inc. | Ari Bousbib | $28,615,851 | $13,489,241 | 29% | 24% | 205:1 | $139,803 |
| 42 | Centene Corporation | Michael F. Neidorff | $20,637,990 | $5,736,294 | 60% | 66% | 290:1 | $71,217 |
| 43 | Paramount Global | Robert M. Bakish | $20,035,212 | $6,479,814 | 97% | 5% | 212:1 | $94,580 |
| 44 | Carnival Corporation | Arnold W. Donald | $15,063,788 | $1,894,933 | 57% | 36% | 1740:1 | $8,658 |
| 45 | Wells Fargo & Company | Charles W. Scharf | $21,350,906 | $7,336,567 | 25% | 27% | 290:1 | $73,578 |
| 46 | Ford Motor Company | James D. Farley Jr. | $22,813,174 | $8,226,963 | 13% | 8% | 356:1 | 64,003 |
| 47 | Citigroup Inc. | Jane Fraser | $20,541,324 | $6,508,752 | 16% | 19% | 372:1 | $55,285 |
| 48 | Howmet Aerospace Inc. | John C. Plant | $17,189,000 | $2,570,586 | 62% | 48% | 415:1 | $58,921 |
| 49 | Corning Incorporated | Wendell P. Weeks | $20,766,032 | $6,319,068 | 12% | 10% | 509:1 | $40,760 |
| 50 | Johnson & Johnson | Alex Gorsky | $26,741,959 | $12,249,565 | 9% | 14% | 297:1 | 90,000 |
| 51 | Procter & Gamble Company | David S. Taylor | $23,900,381 | $9,208,077 | 9% | 9% | 343:1 | $69,671 |
| 52 | Micron Technology, Inc. | Sanjay Mehrotra | $25,316,709 | $10,261,175 | 8% | 14% | 391:1 | $64,827 |
| 53 | Viatris Inc | Michael Goettler | $14,669,592 | $1,713,251 | 79% | 80% | 398:1 | $36,865 |
| 54 | Caesars Entertainment, Inc. | Thomas R. Reeg | $22,576,517 | $7,018,921 | 9% | 10% | 634:1 | $35,618 |
| 55 | Etsy, Inc. | Josh Silverman | $40,584,292 | $23,548,921 | 14% | 17% | 175:1 | $231,338 |
| 56 | Visa Inc. | Alfred F. Kelly Jr. | $30,944,838 | $15,944,269 | 11% | 11% | 211:1 | $146,420 |
| 57 | First Republic Bank | James H. Herbert II & Hafize Gaye Erkan |
$41,275,730 | $26,682,070 | 40% | 44% | 110:1 | $162,300 |
| 58 | CME Group Inc. | Terrence A. Duffy | $22,924,737 | $8,030,172 | 72% | 77% | 150:1 | $153,565 |
| 59 | PayPal Holdings, Inc. | Daniel H. Schulman | $32,070,353 | $17,020,673 | 7% | 11% | 382:1 | 83,905 |
| 60 | Adobe Inc. | Shantanu Narayen | $36,128,725 | $20,763,787 | 9% | 12% | 218:1 | $165,733 |
| 61 | Twitter, Inc. | Parag Agrawal | $30,351,152 | $15,345,616 | 30% | 42% | 130:1 | $232,626 |
| 62 | Accenture plc | Julie Sweet | $23,085,391 | $7,886,531 | 7% | 8% | 1227:1 | $18,821 |
| 63 | Royal Caribbean Cruises Ltd. | Richard D. Fain | $15,812,027 | $1,876,637 | 22% | 21% | 1075:1 | $14,706 |
| 64 | Cigna Corporation | David M. Cordani | $19,872,266 | $5,347,592 | 15% | 17% | 297:1 | $66,917 |
| 65 | Meta Platforms, Inc. | Mark Zuckerberg | $26,823,061 | $12,368,936 | 52% | 14% | 92:1 | $292,785 |
| 66 | Fiserv, Inc. | Frank J. Bisignano | $20,385,208 | $5,808,193 | 11% | 12% | 290:1 | $70,276 |
| 67 | Philip Morris International Inc. | André Calantzopoulos | $15,349,110 | $1,258,253 | 23% | 30% | 1055:1 | $18,196 |
| 68 | Align Technology, Inc. | Joseph M. Hogan | $21,591,400 | $6,125,042 | 7% | 8% | 1659:1 | $13,011 |
| 69 | Skyworks Solutions, Inc. | Liam K. Griffin | $16,150,421 | $1,763,096 | 14% | 14% | 928:1 | $17,409 |
| 70 | Equinix, Inc. | Charles Meyers | $23,248,193 | $8,516,880 | 12% | 18% | 190:1 | 122,075 |
| 71 | Omnicom Group Inc | John D. Wren | $19,981,715 | $5,814,780 | 9% | 10% | 395:1 | $50,613 |
| 72 | Lumen Technologies, Inc. | Jeffrey K. Storey | $22,654,781 | $8,892,290 | 8% | 14% | 298:1 | $75,984 |
| 73 | WestRock Co. | David B. Sewell | $21,189,086 | $7,129,001 | 8% | 12% | 333:1 | 63,560 |
| 74 | NextEra Energy, Inc. | James L. Robo | $25,335,936 | $10,171,682 | 9% | 18% | 191:1 | $132,798 |
| 75 | Western Digital Corporation | David V. Goeckeler | $17,093,364 | $3,457,778 | 9% | 18% | 1514:1 | $11,292 |
| 76 | CSX Corporation | James M. Foote | $20,006,806 | $5,005,656 | 38% | 40% | 186:1 | $107,772 |
| 77 | Texas Instruments Incorporated | Richard K. Templeton | $19,195,411 | $4,186,227 | 16% | 17% | 277:1 | $69,407 |
| 78 | ConocoPhillips | Ryan M. Lance | $23,886,640 | $9,013,827 | 26% | 39% | 133:1 | $179,428 |
| 79 | Universal Health Services, Inc. | Marc D. Miller | $14,020,942 | -$152,537 | 100% | 10% | 309:1 | $45,454 |
| 80 | Abbott Laboratories | Robert B. Ford | $24,914,886 | $9,775,441 | 7% | 8% | 254:1 | $97,952 |
| 81 | Monster Beverage Corporation | Rodney C. Sacks & Hilton H. Schlosberg |
$33,394,105 | $18,834,301 | 6% | 5% | 241:1 | $69,417 |
| 82 | Monolithic Power Systems, Inc. | Michael R. Hsing | $20,254,831 | $4,311,022 | 8% | 28% | 414:1 | $48,913 |
| 83 | Travelers Companies, Inc. | Alan D. Schnitzer | $19,853,697 | $5,308,653 | 20% | 28% | 181:1 | $109,586 |
| 84 | Valero Energy Corporation | Joseph W. Gorder | $22,684,706 | $8,003,044 | 28% | 30% | 114:1 | $198,219 |
| 85 | Chevron Corporation | Michael K. Wirth | $22,610,285 | $7,951,682 | 23% | 27% | 123:1 | $183,531 |
| 86 | CVS Health Corporation | Karen S. Lynch | $20,388,412 | $5,987,233 | 7% | 8% | 458:1 | $45,010 |
| 87 | The Boeing Company | David L. Calhoun | $21,093,605 | $6,944,188 | 10% | 16% | 169:1 | $124,844 |
| 88 | Allstate Corporation | Thomas J. Wilson | $19,066,920 | $4,412,592 | 8% | 12% | 306:1 | $62,235 |
| 89 | AbbVie, Inc. | Richard A. Gonzalez | $23,912,154 | $8,683,455 | 9% | 11% | 160:1 | $149,662 |
| 90 | Starbucks Corporation | Kevin Johnson | $20,425,163 | $5,873,479 | 6% | 8% | 1579:1 | $12,935 |
| 91 | Wynn Resorts, Limited | Matt Maddox | $12,928,747 | -$809,143 | 69% | 51% | 294:1 | $44,048 |
| 92 | Thermo Fisher Scientific Inc. | Marc N. Casper | $21,234,358 | $5,737,291 | 8% | 12% | 254:1 | $83,666 |
| 93 | Ross Stores, Inc. | Barbara Rentler | $15,989,635 | $1,624,246 | 8% | 14% | 1480:1 | $10,806 |
| 94 | Interpublic Group of Companies, Inc. | Philippe Krakowsky | $17,371,647 | $2,794,237 | 9% | 10% | 290:1 | $59,814 |
| 95 | Cisco Systems, Inc. | Charles H. Robbins | $25,446,695 | $10,774,286 | 7% | 11% | 204:1 | $124,806 |
| 96 | Hewlett Packard Enterprise Company | Antonio F. Neri | $19,052,415 | $4,703,965 | 8% | 10% | 289:1 | $65,944 |
| 97 | NXP Semiconductors NV | Kurt Sievers | $20,911,892 | $6,267,243 | 6% | 8% | 417:1 | $50,138 |
| 98 | Automatic Data Processing, Inc. | Carlos A. Rodriguez | $16,985,259 | $2,031,850 | 12% | 15% | 261:1 | $64,965 |
| 99 | Ameriprise Financial, Inc. | James M. Cracchiolo | $21,229,464 | $6,217,072 | 10% | 19% | 165:1 | $129,010 |
| 100 | Parker-Hannifin Corporation | Thomas L. Williams | $17,034,500 | $2,361,600 | 9% | 11% | 303:1 | $56,274 |
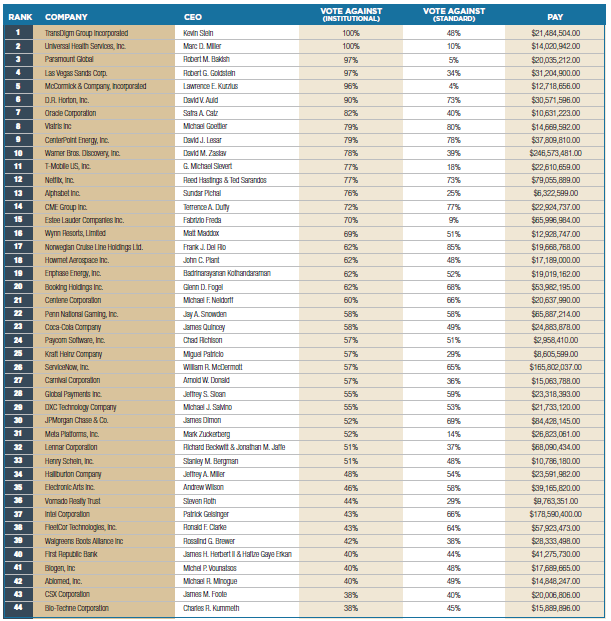
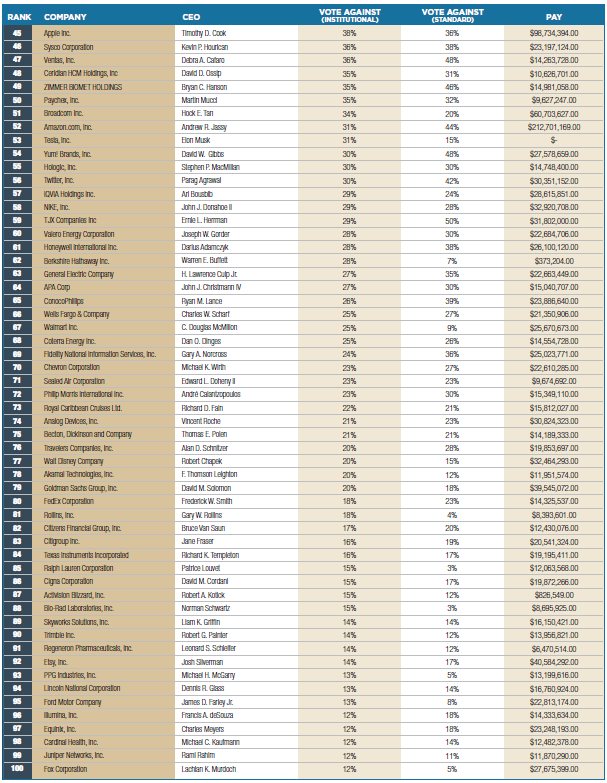
APPENDIX B – S&P 500 COMPANIES WITH MOST SHAREHOLDER VOTES AGAINST CEO PAY
This appendix shows two ways of looking at CEO pay votes: the standard one, as disclosed by the company, and one that was created for us by Insightia, a Diligent Brand. It uses only the votes of institutional investors (those required to file SEC Form 13-F). In these calculations, those votes are used in both the numerator (shares voted against) and denominator (total shares voted) to calculate percentage opposition. We believe this gives a more accurate indication of where institutional investors are most dissatisfied, most starkly in cases where insiders own a particularly large portion of stock or there are dual class shares.
| Rank | Company | CEO | Vote Against (Institutional) | Vote Against (Standard) | CEO Pay |
|---|---|---|---|---|---|
| 1 | TransDigm Group Incorporated | Kevin Stein | 100% | 48% | $21,484,504 |
| 2 | Universal Health Services, Inc. | Marc D. Miller | 100% | 10% | $14,020,942 |
| 3 | Paramount Global | Robert M. Bakish | 97% | 5% | $20,035,212 |
| 4 | Las Vegas Sands Corp. | Robert G. Goldstein | 97% | 34% | $31,204,900 |
| 5 | McCormick & Company, Incorporated | Lawrence E. Kurzius | 96% | 4% | $12,718,656 |
| 6 | D.R. Horton, Inc. | David V. Auld | 90% | 73% | $30,571,596 |
| 7 | Oracle Corporation | Safra A. Catz | 82% | 40% | $10,631,223 |
| 8 | Viatris Inc | Michael Goettler | 79% | 80% | $14,669,592 |
| 9 | CenterPoint Energy, Inc. | David J. Lesar | 79% | 78% | $37,809,810 |
| 10 | Warner Bros. Discovery, Inc. | David M. Zaslav | 78% | 39% | $246,573,481 |
| 11 | T-Mobile US, Inc. | G.Michael Sievert | 77% | 18% | $22,610,659 |
| 12 | Netflix, Inc. | Reed Hastings & Ted Sarandos | 77% | 73% | $79,055,889 |
| 13 | Alphabet Inc. | Sundar Pichai | 76% | 25% | $6,322,599 |
| 14 | CME Group Inc. | Terrence A. Duffy | 72% | 77% | $22,924,737 |
| 15 | Estee Lauder Companies Inc. | Fabrizio Freda | 70% | 9% | $65,996,984 |
| 16 | Wynn Resorts, Limited | Matt Maddox | 69% | 51% | $12,928,747 |
| 17 | Norwegian Cruise Line Holdings Ltd. | Frank J. Del Rio | 62% | 85% | $19,668,768 |
| 18 | Howmet Aerospace Inc. | John C. Plant | 62% | 48% | $17,189,000 |
| 19 | Enphase Energy, Inc. | Badrinarayanan Kothandaraman | 62% | 52% | $19,019,162 |
| 20 | Booking Holdings Inc. | Glenn D. Fogel | 62% | 68% | $53,982,195 |
| 21 | Centene Corporation | Michael F. Neidorff | 60% | 66% | $20,637,990 |
| 22 | Penn National Gaming, Inc. | Jay A. Snowden | 58% | 58% | $65,887,214 |
| 23 | Coca-Cola Company | James Quincey | 58% | 49% | $24,883,878 |
| 24 | Paycom Software, Inc. | Chad Richison | 57% | 51% | $2,958,410 |
| 25 | Kraft Heinz Company | Miguel Patricio | 57% | 29% | $8,605,599 |
| 26 | ServiceNow, Inc. | William R. McDermott | 57% | 65% | $165,802,037 |
| 27 | Carnival Corporation | Arnold W. Donald | 57% | 36% | $15,063,788 |
| 28 | Global Payments Inc. | Jeffrey S. Sloan | 55% | 59% | $23,318,393 |
| 29 | DXC Technology Company | Michael J. Salvino | 55% | 53% | $21,733,120 |
| 30 | JPMorgan Chase & Co. | James Dimon | 52% | 69% | $84,428,145 |
| 31 | Meta Platforms, Inc. | Mark Zuckerberg | 52% | 14% | $26,823,061 |
| 32 | Lennar Corporation | Richard Beckwitt & Jonathan M. Jaffe | 51% | 37% | $68,090,434 |
| 33 | Henry Schein, Inc. | Stanley M. Bergman | 51% | 48% | $10,786,180 |
| 34 | Halliburton Company | Jeffrey A. Miller | 48% | 54% | $23,591,982 |
| 35 | Electronic Arts Inc. | Andrew Wilson | 46% | 58% | $39,165,820 |
| 36 | Vornado Realty Trust | Steven Roth | 44% | 29% | $9,763,351 |
| 37 | Intel Corporation | Patrick Gelsinger | 43% | 66% | $178,590,400 |
| 38 | FleetCor Technologies, Inc. | Ronald F. Clarke | 43% | 64% | $57,923,473 |
| 39 | Walgreens Boots Alliance Inc | Rosalind G. Brewer | 42% | 38% | $28,333,498 |
| 40 | First Republic Bank | James H. Herbert II & Hafize Gaye Erkan | 40% | 44% | $41,275,730 |
| 41 | Biogen, Inc | Michel P. Vounatsos | 40% | 48% | $17,689,665 |
| 42 | Abiomed, Inc. | Michael R. Minogue | 40% | 49% | $14,848,247 |
| 43 | CSX Corporation | James M. Foote | 38% | 40% | $20,006,806 |
| 44 | Bio-Techne Corporation | Charles R. Kummeth | 38% | 45% | $15,889,896 |
| 45 | Apple Inc. | Timothy D. Cook | 38% | 36% | $98,734,394 |
| 46 | Sysco Corporation | Kevin P. Hourican | 36% | 38% | $23,197,124 |
| 47 | Ventas, Inc. | Debra A. Cafaro | 36% | 48% | $14,263,728 |
| 48 | Ceridian HCM Holdings, Inc | David D. Ossip | 35% | 31% | $10,626,701 |
| 49 | ZIMMER BIOMET HOLDINGS | Bryan C. Hanson | 35% | 46% | $14,981,058 |
| 50 | Paychex, Inc. | Martin Mucci | 35% | 32% | $9,627,247 |
| 51 | Broadcom Inc. | Hock E. Tan | 34% | 20% | $60,703,627 |
| 52 | Amazon.com, Inc. | Andrew R. Jassy | 31% | 44% | $212,701,169 |
| 53 | Tesla, Inc. | Elon Musk | 31% | 15% | 0 |
| 54 | Yum! Brands, Inc. | David W. Gibbs | 30% | 48% | $27,578,659 |
| 55 | Hologic, Inc. | Stephen P. MacMillan | 30% | 30% | $14,748,400 |
| 56 | Twitter, Inc. | Parag Agrawal | 30% | 42% | $30,351,152 |
| 57 | IQVIA Holdings Inc. | Ari Bousbib | 29% | 24% | $28,615,851 |
| 58 | NIKE, Inc. | John J. Donahoe II | 29% | 28% | $32,920,708 |
| 59 | TJX Companies Inc | Ernie L. Herrman | 29% | 50% | $31,802,000 |
| 60 | Valero Energy Corporation | Joseph W. Gorder | 28% | 30% | $22,684,706 |
| 61 | Honeywell International Inc. | Darius Adamczyk | 28% | 38% | $26,100,120 |
| 62 | Berkshire Hathaway Inc. | Warren E. Buffett | 28% | 7% | $373,204 |
| 63 | General Electric Company | H. Lawrence Culp Jr. | 27% | 35% | $22,663,449 |
| 64 | APA Corp | John J. Christmann IV | 27% | 30% | $15,040,707 |
| 65 | ConocoPhillips | Ryan M. Lance | 26% | 39% | $23,886,640 |
| 66 | Wells Fargo & Company | Charles W. Scharf | 25% | 27% | $21,350,906 |
| 67 | Walmart Inc. | C. Douglas McMillon | 25% | 9% | $25,670,673 |
| 68 | Coterra Energy Inc. | Dan O. Dinges | 25% | 26% | $14,554,728 |
| 69 | Fidelity National Information Services, Inc. | Gary A. Norcross | 24% | 36% | $25,023,771 |
| 70 | Chevron Corporation | Michael K. Wirth | 23% | 27% | $22,610,285 |
| 71 | Sealed Air Corporation | Edward L. Doheny II | 23% | 23% | $9,674,692 |
| 72 | Philip Morris International Inc. | André Calantzopoulos | 23% | 30% | $15,349,110 |
| 73 | Royal Caribbean Cruises Ltd. | Richard D. Fain | 22% | 21% | $15,812,027 |
| 74 | Analog Devices, Inc. | Vincent Roche | 21% | 23% | $30,824,323 |
| 75 | Becton, Dickinson and Company | Thomas E. Polen | 21% | 21% | $14,189,333 |
| 76 | Travelers Companies, Inc. | Alan D. Schnitzer | 20% | 28% | $19,853,697 |
| 77 | Walt Disney Company | Robert Chapek | 20% | 15% | $32,464,293 |
| 78 | Akamai Technologies, Inc. | F. Thomson Leighton | 20% | 12% | $11,951,574 |
| 79 | Goldman Sachs Group, Inc. | David M. Solomon | 20% | 18% | $39,545,072 |
| 80 | FedEx Corporation | Frederick W. Smith | 18% | 23% | $14,325,537 |
| 81 | Rollins, Inc. | Gary W. Rollins | 18% | 4% | $8,393,601 |
| 82 | Citizens Financial Group, Inc. | Bruce Van Saun | 17% | 20% | $12,430,076 |
| 83 | Citigroup Inc. | Jane Fraser | 16% | 19% | $20,541,324 |
| 84 | Texas Instruments Incorporated | Richard K. Templeton | 16% | 17% | $19,195,411 |
| 85 | Ralph Lauren Corporation | Patrice Louvet | 15% | 3% | $12,063,568 |
| 86 | Cigna Corporation | David M. Cordani | 15% | 17% | $19,872,266 |
| 87 | Activision Blizzard, Inc. | Robert A. Kotick | 15% | 12% | $826,549 |
| 88 | Bio-Rad Laboratories, Inc. | Norman Schwartz | 15% | 3% | $8,695,925 |
| 89 | Skyworks Solutions, Inc. | Liam K. Griffin | 14% | 14% | $16,150,421 |
| 90 | Trimble Inc. | Robert G. Painter | 14% | 12% | $13,956,821 |
| 91 | Regeneron Pharmaceuticals, Inc. | Leonard S. Schleifer | 14% | 12% | $6,470,514 |
| 92 | Etsy, Inc. | Josh Silverman | 14% | 17% | $40,584,292 |
| 93 | PPG Industries, Inc. | Michael H. McGarry | 13% | 5% | $13,199,616 |
| 94 | Lincoln National Corporation | Dennis R. Glass | 13% | 14% | $16,760,924 |
| 95 | Ford Motor Company | James D. Farley Jr. | 13% | 8% | $22,813,174 |
| 96 | Illumina, Inc. | Francis A. deSouza | 12% | 18% | $14,333,634 |
| 97 | Equinix, Inc. | Charles Meyers | 12% | 18% | $23,248,193 |
| 98 | Cardinal Health, Inc. | Michael C. Kaufmann | 12% | 14% | $12,482,378 |
| 99 | Juniper Networks, Inc. | Rami Rahim | 12% | 11% | $11,870,290 |
| 100 | Fox Corporation | Lachlan K. Murdoch | 12% | 5% | $27,675,399 |
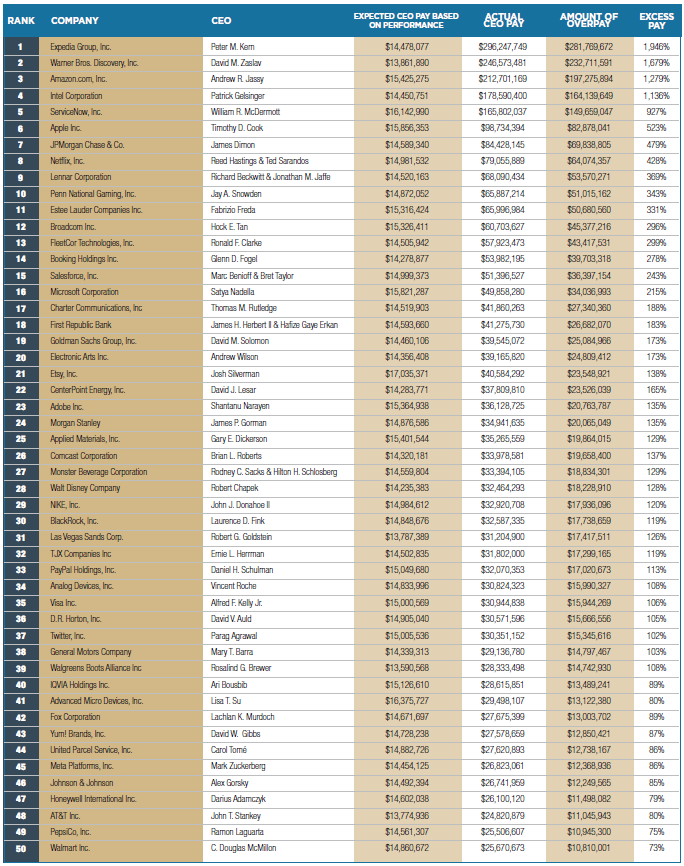
APPENDIX C – HIP INVESTOR REGRESSION ANALYSIS
This table lists Overpaid CEOs as calculated by the HIP Investor regression analysis, comparing CEO pay to company financial performance returns to shareholders.
We, like many other analysts, find very weak links between pay amounts and company financial performance. The usual justification for high executive pay is that higher pay is intended to be a reward for higher profits and above-average capital appreciation. Yet, this does not always follow – and shareholders foot the bill of excess pay. And, shareholders in firms that overpay their CEOs also may suffer lagging financial performance.
However, if we follow the assumption that pay should be determined by performance and then use a basic statistical technique to map actual performance outcomes to predicted levels of pay relative to those outcomes, we can then see how much the CEO pay package exceeded such a prediction. Those with the highest excess are ranked in the table below – and constitute this list of overpaid CEOs of the S&P 500.
Raw data included:
Compensation: Total disclosed compensation collected from the SEC proxy disclosure (DEF 14A) from 2011 to 2021 on an annual rhythm. Collected by ESGAUGE for the latest 2021 data and ISS prior to that.
Financial indicator: Total return (capital gains and dividends) on the company’s primary equity. This is calculated from the Refinitiv Return Index on an annual rhythm using trailing periods behind June 30 of the year of the pay package. Performance factors were calculated across one-year, three-year, and five-year windows, trailing behind each possible pay year. Thus, data were considered as far back as 2007.
Calculation:
Each (company, year) value is paired with the different performances for that year, and then for each performance measure, the regression is calculated.
After verifying that the regressions for the time periods are comparable, a waterfall is implemented to use the financial indicator for each company with the longest time window (five-year over three-year over the one-year window) to calculate the expected compensation based on performance and the regressions.
All calculations are performed in Python 3 using JupyterLab.
As part of arriving at this methodology, we considered other financial and compensation metrics, including compensation of the highest-paid named executive officer, the total compensation to all named executive officers combined, and return on invested capital (ROIC).
| Rank | Company | CEO | Expected CEO Pay based on Performance |
Actual CEO Pay |
Amount of Overpay |
Excess pay |
|---|---|---|---|---|---|---|
| 1 | Expedia Group, Inc. | Peter M. Kern | $14,478,077 | $296,247,749 | $281,769,672 | 1946% |
| 2 | Warner Bros. Discovery, Inc. | David M. Zaslav | $13,861,890 | $246,573,481 | $232,711,591 | 1679% |
| 3 | Amazon.com, Inc. | Andrew R. Jassy | $15,425,275 | $212,701,169 | $197,275,894 | 1279% |
| 4 | Intel Corporation | Patrick Gelsinger | $14,450,751 | $178,590,400 | $164,139,649 | 1136% |
| 5 | ServiceNow, Inc. | William R. McDermott | $16,142,990 | $165,802,037 | $149,659,047 | 927% |
| 6 | Apple Inc. | Timothy D. Cook | $15,856,353 | $98,734,394 | $82,878,041 | 523% |
| 7 | JPMorgan Chase & Co. | James Dimon | $14,589,340 | $84,428,145 | $69,838,805 | 479% |
| 8 | Netflix, Inc. | Reed Hastings & Ted Sarandos |
$14,981,532 | $79,055,889 | $64,074,357 | 428% |
| 9 | Lennar Corporation | Richard Beckwitt & Jonathan M. Jaffe |
$14,520,163 | $68,090,434 | $53,570,271 | 369% |
| 10 | Penn National Gaming, Inc. | Jay A. Snowden | $14,872,052 | $65,887,214 | $51,015,162 | 343% |
| 11 | Estee Lauder Companies Inc. | Fabrizio Freda | $15,316,424 | $65,996,984 | $50,680,560 | 331% |
| 12 | Broadcom Inc. | Hock E. Tan | $15,326,411 | $60,703,627 | $45,377,216 | 296% |
| 13 | FleetCor Technologies, Inc. | Ronald F. Clarke | $14,505,942 | $57,923,473 | $43,417,531 | 299% |
| 14 | Booking Holdings Inc. | Glenn D. Fogel | $14,278,877 | $53,982,195 | $39,703,318 | 278% |
| 15 | Salesforce, Inc. | Marc Benioff & Bret Taylor |
$14,999,373 | $51,396,527 | $36,397,154 | 243% |
| 16 | Microsoft Corporation | Satya Nadella | $15,821,287 | $49,858,280 | $34,036,993 | 215% |
| 17 | Charter Communications, Inc | Thomas M. Rutledge | $14,519,903 | $41,860,263 | $27,340,360 | 188% |
| 18 | First Republic Bank | James H. Herbert II & Hafize Gaye Erkan |
$14,593,660 | $41,275,730 | $26,682,070 | 183% |
| 19 | Goldman Sachs Group, Inc. | David M. Solomon | $14,460,106 | $39,545,072 | $25,084,966 | 173% |
| 20 | Electronic Arts Inc. | Andrew Wilson | $14,356,408 | $39,165,820 | $24,809,412 | 173% |
| 21 | Etsy, Inc. | Josh Silverman | $17,035,371 | $40,584,292 | $23,548,921 | 138% |
| 22 | CenterPoint Energy, Inc. | David J. Lesar | $14,283,771 | $37,809,810 | $23,526,039 | 165% |
| 23 | Adobe Inc. | Shantanu Narayen | $15,364,938 | $36,128,725 | $20,763,787 | 135% |
| 24 | Morgan Stanley | James P. Gorman | $14,876,586 | $34,941,635 | $20,065,049 | 135% |
| 25 | Applied Materials, Inc. | Gary E. Dickerson | $15,401,544 | $35,265,559 | $19,864,015 | 129% |
| 26 | Comcast Corporation | Brian L. Roberts | $14,320,181 | $33,978,581 | $19,658,400 | 137% |
| 27 | Monster Beverage Corporation | Rodney C. Sacks & Hilton H. Schlosberg |
$14,559,804 | $33,394,105 | $18,834,301 | 129% |
| 28 | Walt Disney Company | Robert Chapek | $14,235,383 | $32,464,293 | $18,228,910 | 128% |
| 29 | NIKE, Inc. | John J. Donahoe II | $14,984,612 | $32,920,708 | $17,936,096 | 120% |
| 30 | BlackRock, Inc. | Laurence D. Fink | $14,848,676 | $32,587,335 | $17,738,659 | 119% |
| 31 | Las Vegas Sands Corp. | Robert G. Goldstein | $13,787,389 | $31,204,900 | $17,417,511 | 126% |
| 32 | TJX Companies Inc | Ernie L. Herrman | $14,502,835 | $31,802,000 | $17,299,165 | 119% |
| 33 | PayPal Holdings, Inc. | Daniel H. Schulman | $15,049,680 | $32,070,353 | $17,020,673 | 113% |
| 34 | Analog Devices, Inc. | Vincent Roche | $14,833,996 | $30,824,323 | $15,990,327 | 108% |
| 35 | Visa Inc. | Alfred F. Kelly Jr. | $15,000,569 | $30,944,838 | $15,944,269 | 106% |
| 36 | D.R. Horton, Inc. | David V. Auld | $14,905,040 | $30,571,596 | $15,666,556 | 105% |
| 37 | Twitter, Inc. | Parag Agrawal | $15,005,536 | $30,351,152 | $15,345,616 | 102% |
| 38 | General Motors Company | Mary T. Barra | $14,339,313 | $29,136,780 | $14,797,467 | 103% |
| 39 | Walgreens Boots Alliance Inc | Rosalind G. Brewer | $13,590,568 | $28,333,498 | $14,742,930 | 108% |
| 40 | IQVIA Holdings Inc. | Ari Bousbib | $15,126,610 | $28,615,851 | $13,489,241 | 89% |
| 41 | Advanced Micro Devices, Inc. | Lisa T. Su | $16,375,727 | $29,498,107 | $13,122,380 | 80% |
| 42 | Fox Corporation | Lachlan K. Murdoch | $14,671,697 | $27,675,399 | $13,003,702 | 89% |
| 43 | Yum! Brands, Inc. | David W. Gibbs | $14,728,238 | $27,578,659 | $12,850,421 | 87% |
| 44 | United Parcel Service, Inc. | Carol Tom | $14,882,726 | $27,620,893 | $12,738,167 | 86% |
| 45 | Meta Platforms, Inc. | Mark Zuckerberg | $14,454,125 | $26,823,061 | $12,368,936 | 86% |
| 46 | Johnson & Johnson | Alex Gorsky | $14,492,394 | $26,741,959 | $12,249,565 | 85% |
| 47 | Honeywell International Inc. | Darius Adamczyk | $14,602,038 | $26,100,120 | $11,498,082 | 79% |
| 48 | AT&T Inc. | John T. Stankey | $13,774,936 | $24,820,879 | $11,045,943 | 80% |
| 49 | PepsiCo, Inc. | Ramon Laguarta | $14,561,307 | $25,506,607 | $10,945,300 | 75% |
| 50 | Walmart Inc. | C. Douglas McMillon | $14,860,672 | $25,670,673 | $10,810,001 | 73% |
| 51 | Cisco Systems, Inc. | Charles H. Robbins | $14,672,409 | $25,446,695 | $10,774,286 | 73% |
| 52 | Fidelity National Information Services, Inc. | Gary A. Norcross | $14,294,603 | $25,023,771 | $10,729,168 | 75% |
| 53 | American Express Company | Stephen J. Squeri | $14,984,638 | $25,513,922 | $10,529,284 | 70% |
| 54 | Coca-Cola Company | James Quincey | $14,551,808 | $24,883,878 | $10,332,070 | 71% |
| 55 | Micron Technology, Inc. | Sanjay Mehrotra | $15,055,534 | $25,316,709 | $10,261,175 | 68% |
| 56 | Dow Inc. | Jim Fitterling | $14,674,393 | $24,858,892 | $10,184,499 | 69% |
| 57 | NextEra Energy, Inc. | James L. Robo | $15,164,254 | $25,335,936 | $10,171,682 | 67% |
| 58 | Sempra Energy | Jeffrey W. Martin | $14,591,900 | $24,675,982 | $10,084,082 | 69% |
| 59 | Abbott Laboratories | Robert B. Ford | $15,139,445 | $24,914,886 | $9,775,441 | 65% |
| 60 | Hasbro, Inc. | Brian D. Goldner | $13,950,896 | $23,714,681 | $9,763,785 | 70% |
| 61 | Halliburton Company | Jeffrey A. Miller | $13,850,484 | $23,591,982 | $9,741,498 | 70% |
| 62 | Pfizer Inc. | Albert Bourla | $14,673,571 | $24,353,219 | $9,679,648 | 66% |
| 63 | Prologis, Inc. | Hamid Moghadam | $15,376,519 | $24,901,490 | $9,524,971 | 62% |
| 64 | General Electric Company | H. Lawrence Culp Jr. | $13,260,452 | $22,663,449 | $9,402,997 | 71% |
| 65 | Intuit Inc. | Sasan K. Goodarzi | $15,624,770 | $24,929,237 | $9,304,467 | 60% |
| 66 | Exxon Mobil Corporation | Darren W. Woods | $14,272,450 | $23,572,488 | $9,300,038 | 65% |
| 67 | Caterpillar Inc. | D. James Umpleby III | $15,065,686 | $24,298,032 | $9,232,346 | 61% |
| 68 | Procter & Gamble Company | David S. Taylor | $14,692,304 | $23,900,381 | $9,208,077 | 63% |
| 69 | General Dynamics Corporation | Phebe N. Novakovic | $14,369,663 | $23,553,861 | $9,184,198 | 64% |
| 70 | Match Group, Inc. | Sharmistha Dubey | $16,276,244 | $25,397,675 | $9,121,431 | 56% |
| 71 | Bank of America Corporation | Brian T. Moynihan | $14,681,855 | $23,729,169 | $9,047,314 | 62% |
| 72 | ConocoPhillips | Ryan M. Lance | $14,872,813 | $23,886,640 | $9,013,827 | 61% |
| 73 | Lumen Technologies, Inc. | Jeffrey K. Storey | $13,762,491 | $22,654,781 | $8,892,290 | 65% |
| 74 | Raytheon Technologies Corporation | Gregory J. Hayes | $14,532,809 | $23,316,063 | $8,783,254 | 60% |
| 75 | Global Payments Inc. | Jeffrey S. Sloan | $14,553,098 | $23,318,393 | $8,765,295 | 60% |
| 76 | AbbVie, Inc. | Richard A. Gonzalez | $15,228,699 | $23,912,154 | $8,683,455 | 57% |
| 77 | Archer-Daniels-Midland Company | Juan R. Luciano | $14,859,905 | $23,508,841 | $8,648,936 | 58% |
| 78 | Chubb Ltd | Evan G. Greenberg | $14,566,571 | $23,181,184 | $8,614,613 | 59% |
| 79 | Sysco Corporation | Kevin P. Hourican | $14,597,099 | $23,197,124 | $8,600,025 | 59% |
| 80 | Equinix, Inc. | Charles Meyers | $14,731,313 | $23,248,193 | $8,516,880 | 58% |
| 81 | News Corporation | Robert J. Thomson | $14,589,139 | $23,024,845 | $8,435,706 | 58% |
| 82 | Hilton Worldwide Holdings Inc | Christopher J. Nassetta | $15,035,274 | $23,285,248 | $8,249,974 | 55% |
| 83 | Ford Motor Company | James D. Farley Jr. | $14,586,211 | $22,813,174 | $8,226,963 | 56% |
| 84 | DXC Technology Company | Michael J. Salvino | $13,506,487 | $21,733,120 | $8,226,633 | 61% |
| 85 | CME Group Inc. | Terrence A. Duffy | $14,894,565 | $22,924,737 | $8,030,172 | 54% |
| 86 | Valero Energy Corporation | Joseph W. Gorder | $14,681,662 | $22,684,706 | $8,003,044 | 55% |
| 87 | Chevron Corporation | Michael K. Wirth | $14,658,603 | $22,610,285 | $7,951,682 | 54% |
| 88 | T-Mobile US, Inc. | G. Michael Sievert | $14,708,956 | $22,610,659 | $7,901,703 | 54% |
| 89 | Accenture plc | Julie Sweet | $15,198,860 | $23,085,391 | $7,886,531 | 52% |
| 90 | American International Group, Inc. | Peter Zaffino | $14,144,848 | $21,905,220 | $7,760,372 | 55% |
| 91 | Wells Fargo & Company | Charles W. Scharf | $14,014,339 | $21,350,906 | $7,336,567 | 52% |
| 92 | Amgen Inc. | Robert A. Bradway | $14,543,714 | $21,721,154 | $7,177,440 | 49% |
| 93 | Autodesk, Inc. | Andrew Anagnost | $14,956,220 | $22,095,521 | $7,139,301 | 48% |
| 94 | WestRock Co. | David B. Sewell | $14,060,085 | $21,189,086 | $7,129,001 | 51% |
| 95 | Schwab Charles Corp | Walter W. Bettinger II | $14,819,829 | $21,938,404 | $7,118,575 | 48% |
| 96 | eBay Inc. | Jamie Iannone | $14,591,828 | $21,685,102 | $7,093,274 | 49% |
| 97 | Caesars Entertainment, Inc. | Thomas R. Reeg | $15,557,596 | $22,576,517 | $7,018,921 | 45% |
| 98 | The Boeing Company | David L. Calhoun | $14,149,417 | $21,093,605 | $6,944,188 | 49% |
| 99 | NVIDIA Corporation | Jen-Hsun Huang | $16,816,441 | $23,737,661 | $6,921,220 | 41% |
| 100 | Phillips 66 Company | Greg Garland | $14,286,175 | $20,953,206 | $6,667,031 | 47% |
APPENDIX D – FINANCIAL FUND MANAGERS’ OPPOSITION TO CEO PAY
This table summarizes more than 100 financial fund managers on their CEO pay votes at all S&P 500 companies and the 100 companies with the Most Overpaid CEOs.
| Financial Manager | AUM in Billions |
Votes Against S&P 500 |
Votes Against Top 100 |
|---|---|---|---|
| abrdn | $508 | 81% | 95% |
| Achmea | $104 | 81% | 95% |
| Achmea Investment Management | $131 | 78% | 91% |
| Advance Asset Management (Multi-Managed) | $29 | 5% | 21% |
| AEGON Investment Management B.V | $461 | 12% | 44% |
| AllianceBernstein LP | $722 | 10% | 37% |
| Allianz Global Investors | $578 | 80% | 81% |
| American Beacon Advisors, Inc. | $69 | 7% | 19% |
| American Century | $234 | 14% | 37% |
| Amundi Asset Management | $1,811 | 71% | 79% |
| Amundi Asset Management (Japan) | $40 | 71% | 78% |
| Amundi Asset Management US | $101 | 13% | 44% |
| Andra AP-Fonden | $35 | 88% | 88% |
| AQR Capital Management LLC | $145 | 12% | 45% |
| Artemis Investment Management LLP | $35 | 21% | 40% |
| Artisan Partners | $176 | 13% | 39% |
| Assetmark, Inc. | $60 | 5% | 30% |
| Aviva Investors | $405 | 88% | 99% |
| AXA Equitable Life Insurance Co. (Multi-Managed) | $- | 3% | 13% |
| AXA Investment Managers | $112 | 78% | 87% |
| BAMCO Inc. | $45 | 22% | 39% |
| Baring Asset Management | $40 | 12% | 45% |
| Barrow, Hanley, Mewhinney & Strauss, LLC | $47 | 10% | 37% |
| Bessemer Investment Management LLC | $48 | 13% | 41% |
| BlackRock Inc. | $8,487 | 6% | 25% |
| BMO Global Asset Management | $710 | 51% | 63% |
| BNP Paribas Asset Management | $535 | 96% | 98% |
| BNY Mellon | $2,400 | 27% | 58% |
| BNY Mellon (Multi-Managed) | $583 | 32% | 61% |
| Boston Common Asset Management, LLC | $6 | 48% | 67% |
| Boston Management and Research | $131 | 12% | 44% |
| Boston Partners | $87 | 12% | 36% |
| Boston Trust Walden Company | $- | 32% | 54% |
| Brandywine Global Investment Management | $69 | 9% | 42% |
| Brown Advisory, LLC | $121 | 11% | 31% |
| Calamos Advisors, LLC | $42 | 0% | 0% |
| Calvert Research and Management, Inc. | $40 | 43% | 76% |
| CANDRIAM | $128 | 96% | 96% |
| Capital Group | $2,600 | 12% | 37% |
| Charles Schwab Investment Management, Inc. | $701 | 12% | 48% |
| Christian BrothersInvestment Services(CBIS) | $11 | 22% | 51% |
| City National Rochdale, LLC | $58 | 11% | 31% |
| ClearBridge Investments LLC | $190 | 14% | 38% |
| Columbia Threadneedle UK | $468 | 14% | 46% |
| Columbia Threadneedle US | $459 | 13% | 59% |
| Cornerstone Capital Management, LLC | $14 | 13% | 46% |
| Coronation Fund Managers Ltd | $36 | 22% | 39% |
| Credit Suisse Asset Management LLC | $508 | 88% | 98% |
| D.E. Shaw Investment Management | $28 | 14% | 48% |
| Danske Bank A/S | $704 | 13% | 45% |
| Davenport & Company, LLC | $21 | 22% | 52% |
| Delaware Management Company (Macquarie) | $257 | 11% | 40% |
| Diamond Hill Capital Management, Inc | $31 | 4% | 14% |
| Dimensional Fund Advisors, Inc. | $743 | 19% | 67% |
| Domini Impact Investments, LLC | $3 | 81% | 97% |
| DoubleLine Capital | $134 | 0% | 0% |
| DWS Investment GmbH | $833 | 57% | 73% |
| DWS Investment Management Americas, Inc. | $207 | 12% | 48% |
| Eagle Asset Management, Inc. | $39 | 12% | 47% |
| Eaton Vance Management, Inc. | $86 | 17% | 45% |
| EdenTree Investment Management | $3 | 97% | 100% |
| Engine No. 1 | $- | 12% | 44% |
| Epoch Investment Partners | $34 | 13% | 42% |
| Erste Asset Management | $2 | 90% | 100% |
| Everence Capital Management, Inc | $66 | 17% | 42% |
| Federated Hermes Equity Ownership Services | $44 | 44% | 78% |
| Federated Investment Management Co. | $422 | 7% | 27% |
| Fidelity Institutional Asset Management | $140 | 4% | 17% |
| Fidelity International | $401 | 17% | 35% |
| Fidelity Management & Research Co. (FMR) | $4,283 | 4% | 17% |
| First Pacific Advisors LLC | $30 | 4% | 10% |
| First Sentier Investors | $155 | 18% | 60% |
| First Trust Advisors LP | $224 | 13% | 48% |
| Fisher Investments | $209 | 14% | 39% |
| Fjarde Ap-Fonden | $37 | 89% | 91% |
| Första AP-fonden (AP1) | $34 | 89% | 90% |
| Fort Washington Investment Advisors, Inc. | $78 | 16% | 39% |
| Franklin Templeton Investments | $1,478 | 8% | 29% |
| Fred Alger Management, Inc | $37 | 21% | 58% |
| GAMCO Investors | $13 | 2% | 1% |
| Geode Capital Management | $915 | 8% | 34% |
| Global X Management Co., LLC | $44 | 14% | 54% |
| Goldman Sachs Asset Management LP | $2,470 | 10% | 42% |
| Grantham, Mayo, Van Otterloo Co. LLC | $72 | 0% | 0% |
| Green Century Capital Management, Inc. | $1 | 76% | 70% |
| Guggenheim Investments | $255 | 12% | 47% |
| GuideStone Funds | $29 | 44% | 60% |
| Harbor Capital Advisors, Inc | $65 | 9% | 29% |
| Harding Loevner, LLC | $75 | 11% | 19% |
| Harris Associates | $120 | 2% | 5% |
| HSBC Global Asset Management | $621 | 90% | 95% |
| INTECH Investment Management, LLC | $46 | 10% | 42% |
| Invesco Advisers, Inc. | $805 | 9% | 29% |
| Invesco Asset Management Limited | $113 | 9% | 30% |
| Invesco Canada Ltd. | $25 | 10% | 38% |
| Invesco Capital Management, LLC | $478 | 10% | 35% |
| Irish Life Investment Managers Limited | $118 | 22% | 56% |
| Janus Henderson Group PLC | $300 | 11% | 43% |
| Janus Henderson Investors (US) | $269 | 6% | 20% |
| Jennison Associates, LLC | $246 | 14% | 47% |
| JP Morgan | $2,960 | 8% | 32% |
| Kempen Capital Management | $63 | 25% | 56% |
| KLP Kapitalforvaltning | $60 | 22% | 52% |
| La Française Asset Management | $76 | 19% | 45% |
| Lazard Asset Management LLC | $177 | 11% | 35% |
| Legal & General Investment Management | $1,327 | 77% | 85% |
| Liontrust Asset Management, PLC | $372 | 15% | 44% |
| Lombard Odier Investment Managers | $45 | 12% | 44% |
| Loomis, Sayles & Co. LP | $264 | 15% | 33% |
| Lord Abbett & Co. LLC | $262 | 7% | 19% |
| Los Angeles Capital Management and Equity Research, Inc. | $37 | 14% | 54% |
| LSV Asset Management | $109 | 12% | 51% |
| M&G Investments | $360 | 10% | 38% |
| MacKay Shields, LLC | $164 | 13% | 47% |
| Manulife Investment Management | $221 | 11% | 40% |
| Mason Street Advisors, LLC | $32 | 5% | 21% |
| Massachusetts Mutual Life Insurance Co. | $771 | 3% | 10% |
| Mercy Investment Services | $- | 22% | 53% |
| MetLife, Inc. | $558 | 12% | 44% |
| MFS Investment Management, Inc. | $557 | 7% | 30% |
| Morgan Stanley Investment Management, Inc. | $633 | 18% | 58% |
| Mutual of America Capital Management Corporation | $21 | 12% | 47% |
| Nationwide Fund Advisors | $96 | 13% | 47% |
| Natixis Investment Managers | $1,400 | 7% | 24% |
| NEI Investments | $5 | 95% | 100% |
| Neuberger Berman Group | $365 | 11% | 43% |
| New York Life Investment Management, LLC | $111 | 11% | 37% |
| Newton Investment Management | $60 | 52% | 74% |
| Ninety One | $129 | 10% | 32% |
| Nordea Bank Oyj | $667 | 82% | 95% |
| Northern Trust Investments | $1,607 | 7% | 31% |
| Nuveen Asset Management LLC | $298 | 13% | 49% |
| Old Mutual PLC | $48 | 19% | 48% |
| Pacer Advisors, Inc | $12 | 14% | 54% |
| PanAgora Asset Management, Inc. | $48 | 12% | 48% |
| Parametric Portfolio Associates, LLC | $429 | 32% | 70% |
| Parnassus Investments | $53 | 22% | 48% |
| Penn Mutual Asset Management, LLC | $35 | 3% | 13% |
| PenSam | $17 | 12% | 41% |
| PFM Asset Management, LLC | $130 | 6% | 29% |
| PGIM Quantitative Solutions, LLC | $122 | 17% | 53% |
| Pictet Asset Management Limited | $273 | 13% | 47% |
| PineBridge Investments, LLC | $69 | 12% | 44% |
| PRIMECAP Management Co. | $154 | 4% | 10% |
| Principal Global Investors, LLC | $340 | 12% | 45% |
| Principal Global Investors, LLC (Multi-Managed) | $- | 7% | 28% |
| ProShares | $65 | 13% | 48% |
| Putnam Investment Management, LLC | $116 | 4% | 16% |
| Rafferty Asset Management, LLC | $31 | 13% | 48% |
| Railpen (RMPI) | $39 | 79% | 77% |
| Rathbones | $49 | 17% | 46% |
| RBC Global Asset Management, Inc. | $476 | 12% | 46% |
| Reflection Asset Management | $3 | 76% | 81% |
| RhumbLine Advisers Ltd. Partnership | $96 | 22% | 57% |
| Robeco/RobecoSAM | $226 | 70% | 92% |
| Royal London Asset Management | $156 | 71% | 90% |
| Russell Investment Management Co. | $330 | 16% | 58% |
| Schroders PLC | $939 | 42% | 61% |
| Securian Asset Management, Inc. | $55 | 13% | 56% |
| SEI Investments Management Corp. | $223 | 14% | 55% |
| SEI Investments Management Corp. (Multi-Managed) | $- | 13% | 53% |
| State Street Corporation | $3,475 | 7% | 28% |
| Sterling Capital Management, LLC | $75 | 11% | 41% |
| Storebrand Asset Management | $85 | 16% | 44% |
| SunAmerica Asset Management Corp. | $63 | 13% | 48% |
| Swedbank Robur | $154 | 99% | 98% |
| Swisscanto | $160 | 25% | 61% |
| T. Rowe Price Associates, Inc. | $1,310 | 5% | 21% |
| TCW Asset Management Co., Inc. | $65 | 19% | 37% |
| Thompson, Siegel & Walmsley | $24 | 21% | 50% |
| Thrivent Investment Management, Inc. | $13 | 13% | 47% |
| TIAA-CREF Asset Management LLC | $283 | 8% | 30% |
| TKP Investments | $33 | 12% | 45% |
| TrilliumAsset Management Corp. | $6 | 100% | 98% |
| UBS Asset Management | $300 | 50% | 80% |
| UBS Asset Management (Multi-Managed) | $- | 17% | 25% |
| Union Investment | $438 | 95% | 94% |
| United Church Funds | $1 | 22% | 58% |
| United Services Automobile Association (USAA) | $155 | 11% | 40% |
| Van Eck Associates Corp. | $68 | 17% | 52% |
| Vanguard Group, Inc. | $7,796 | 5% | 26% |
| Victory Capital Management, Inc. | $170 | 12% | 46% |
| Voya Investment Management | $330 | 16% | 45% |
| Waddell & Reed Investment Management Co. | $33 | 12% | 34% |
| Wellington Management | $1,488 | 10% | 39% |
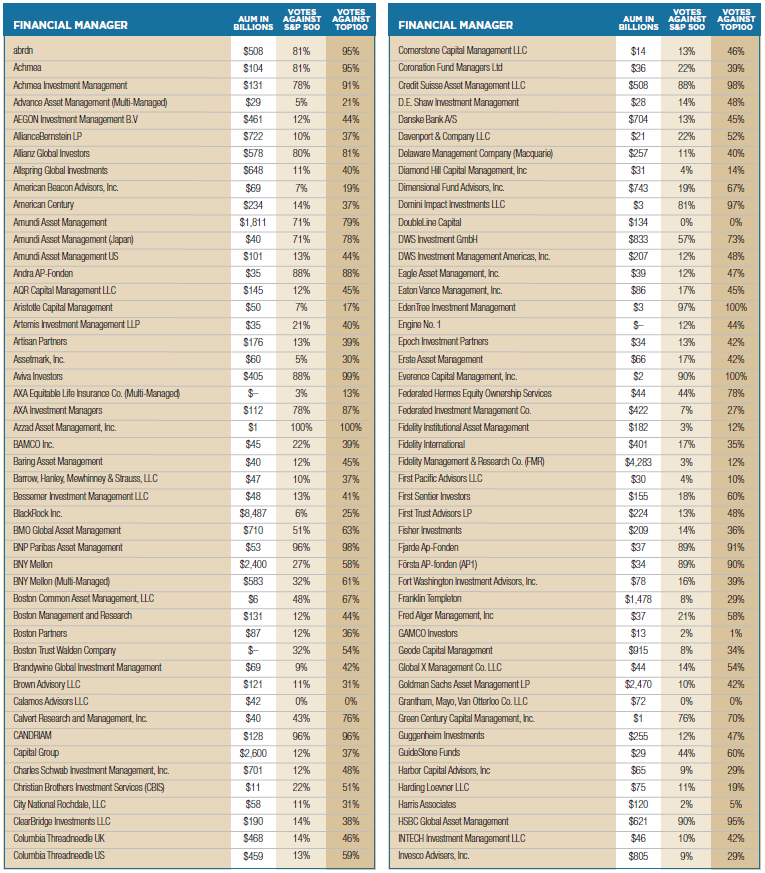
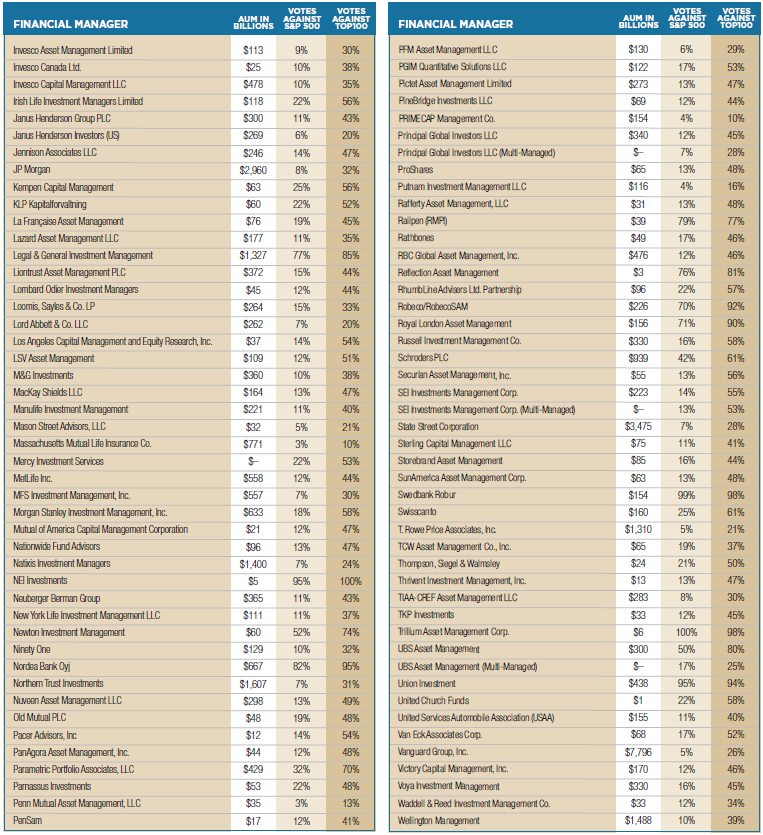
APPENDIX E – PENSION FUND OPPOSITION TO CEO PAY
Data provided by Insightia, a Diligent Brand.
| Fund Name | AUM in Billions |
Votes Against S&P 500 |
Votes Against Top 100 |
|---|---|---|---|
| Alberta Investment Management Corporation (AIMco) | $119 | 19% | 52% |
| AP Pension (Danish Pension Fund) | $20 | 12% | 45% |
| APG (Dutch Pension Fund) | $711 | 66% | 80% |
| Arizona State Retirement System | $41 | 24% | 67% |
| ASR Nederland (Dutch Insurance Company) | $67 | 11% | 43% |
| AustralianSuper (Australian Pension Fund) | $99 | 74% | 86% |
| Aware Super (Australian Pension Fund) | $53 | 14% | 48% |
| bpfBOUW (Dutch Pension Fund) | $53 | 66% | 80% |
| BPL Pensioen (Dutch Pension Fund) | $19 | 85% | 94% |
| British Columbia Investment Management Corporation | $171 | 39% | 74% |
| Brunel Pension Partnership (British Pension Fund) | $40 | 71% | 80% |
| BVK Personalvorsorge des Kantons Zürich (Swiss Pension Fund) | $32 | 28% | 62% |
| Caisse de depot et placement du Quebec | $307 | 19% | 48% |
| California Public Employees' Retirement System (CalPERS) | $499 | 46% | 79% |
| California State Teachers' Retirement System (CalSTRS) | $320 | 28% | 71% |
| Canada Pension Plan Investment Board (CPPIB) | $410 | 14% | 52% |
| Catholic Super (Australian Pension Fund) | $7 | 21% | 25% |
| Cbus Super (Australian Pension Fund) | $34 | 13% | 48% |
| Colorado PERA (Public Employees' Retirement Association of Colorado) | $49 | 13% | 58% |
| Connecticut Retirement Plans and Trust Funds | $34 | 21% | 58% |
| Florida State Board of Administration | $206 | 57% | 88% |
| Illinois State Treasurer | $25 | 45% | 60% |
| Illinois State Universities Retirement System (SURS) (Multi-Managed) | $23 | 22% | 55% |
| Local Pensions Partnership (LPP) (British Pension Fund) | $21 | 17% | 48% |
| Los Angeles City Employees' Retirement System (LACERS) | $23 | 10% | 43% |
| Los Angeles County Employees Retirement Association (LACERA) | $59 | 29% | 61% |
| Los Angeles Fire & Police Pensions | $21 | 13% | 48% |
| Louisiana State Employees' Retirement System (LASERS) | $14 | 44% | 76% |
| Loyola University of Chicago | $2 | 30% | 60% |
| Maine PERS | $14 | 20% | 56% |
| Maryland State Retirement and Pension System | $54 | 12% | 47% |
| Massachusetts Pension Reserves Investment Management (PRIM) | $78 | 33% | 69% |
| Migros Pensionskasse (Swiss Pension Fund) | $25 | 14% | 37% |
| Minnesota State Board of Investment | $129 | 68% | 91% |
| New Hampshire Retirement System | $8 | 10% | 43% |
| New Mexico Educational Retirement Board | $13 | 16% | 45% |
| New York City Pension Funds | $211 | 36% | 83% |
| New York State Common Retirement Fund | $211 | 35% | 77% |
| New York State Teachers' Retirement System | $121 | 15% | 54% |
| Norges Bank Investment Management | $1,333 | 9% | 37% |
| North Carolina Department of State Treasurer | $94 | 29% | 67% |
| Ohio Public Employees Retirement System (OPERS) | $92 | 26% | 65% |
| Ohio State Teachers' Retirement System | $81 | 10% | 47% |
| Ontario Municipal Employees Retirement System (OMERS) | $97 | 5% | 6% |
| Ontario Teachers' Pension Plan | $228 | 25% | 52% |
| Oregon Investment Council | $112 | 20% | 60% |
| Pennsylvania Public School Employees' Retirement System (PSERS) | $59 | 13% | 57% |
| Pennsylvania State Employees' Retirement System (SERS) | $27 | 13% | 47% |
| Pensioenfonds Metaal en Techniek (Dutch Pension Fund) | $81 | 100% | 100% |
| Pensioenfonds Vervoer (Dutch Pension Fund) | $33 | 77% | 90% |
| Pensionskasse SBB (Swiss Pension Fund) | $17 | 83% | 100% |
| Pensionskassernes Administration (PKA) (Swiss Pension Fund) | $23 | 63% | 89% |
| PGGM Investments (Dutch Pension Fund) | $330 | 98% | 99% |
| PSP Investments (Canadian Pension Fund) | $127 | 14% | 53% |
| Rabobank Pensioenfonds (Dutch Pension Fund) | $33 | 69% | 92% |
| Rhode Island Office of the General Treasurer | $8 | 55% | 77% |
| San Francisco Employees Retirement System | $25 | 34% | 65% |
| SunSuper (Australian Pension Fund) | $42 | 7% | 29% |
| Texas Education Agency | $47 | 20% | 53% |
| Texas Employees Retirement System | $33 | 12% | 47% |
| Texas Teacher Retirment System | $182 | 12% | 47% |
| The Pension Boards-United Church of Christ, Inc. (PBUCC) | $3 | 20% | 60% |
| University of California | $126 | 83% | 90% |
| Vermont Pension Investment Committee | $4 | 45% | 62% |
| Washington State Investment Board (WSIB) | $142 | 14% | 55% |
| Wisconsin State Investment Board (SWIB) | $144 | 12% | 48% |
| School Employees Retirement System of Ohio (SERS) | $17 | 24% | 63% |


APPENDIX F – OVERPAID CEOS UNDERPERFORM YEAR AFTER YEAR
By HIP Investor (Onindo Khan and R.Paul Herman)
FIGURE 1: SIGNIFICANT PERFORMANCE GAP BETWEEN THE S&P 500 AND THE 100 MOST OVERPAID
TSR since the publishing of each CEO Pay report from 2015-2022
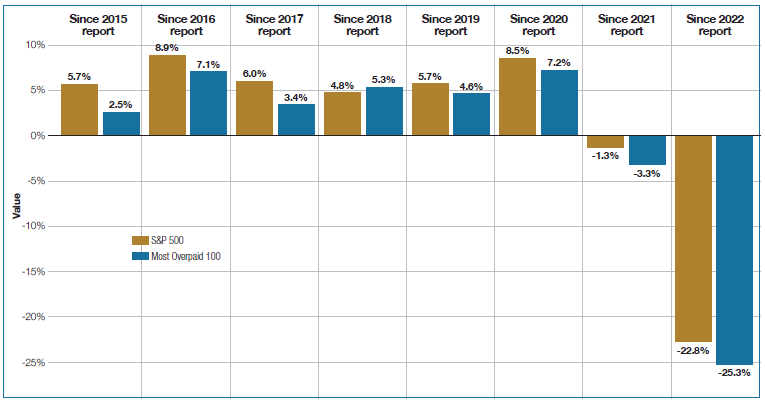
Since 2015, As You Sow has identified the 100 Most Overpaid CEOs. Since 2017, HIP Investor has analyzed the relationship between excessive CEO compensation and typically lagging financial returns for shareholders invested in the 100 Most Overpaid firms.
This year, we had data from eight reports to analyze and look back on. Although the S&P 500 has seen huge dips and rallies (Covid, Ukraine war, interest rate rises), we found one consistency: overpaid CEOs underperform.
For the most overpaid CEOs from seven out of eight reports, we found that the Most Overpaid 100 companies, as a cohort, underperformed the S&P 500, thus impacting investor portfolios that have not divested, under-weighted, or even shorted their stock.
As of September 30, 2022, the Most Overpaid 100 cohort was down and lagging the S&P 500 for all but one report from 2015 through 2022. To returning readers of this report, this is no surprise. Last year, we observed an even stronger pattern of consistent underperformance where each and every Most Overpaid 100 company was lagging the S&P 500.
Beginning with the 2017 report, As You Sow and HIP Investor have been highlighting different dimensions of underperformance. From the initial 2015 Most Overpaid list to the firms recurring as the most consistently overpaid in 2020, we continue to see that overpaying a CEO typically does not pay off for shareholders (with one exception in the 2018 report that was boosted by some high flyers).
In 2021 we highlighted the most consistently overpaid; this year, we want to put our focus on the ten most overpaid. At the same time, the lagging 100 most overpaid were down between 1 and 3 percentage points on the S&P 500, the ten most overpaid of each report underperformed by 2 to 13 percentage points. In 2015, 2017, 2021, and last year’s 2022 reports, the ten most overpaid all underperformed by over eight percentage points.
FIGURE 2: SIGNIFICANT PERFORMANCE GAP BETWEEN THE S&P 500, THE 100 AND 10 MOST OVERPAID
TSR since publishing of each CEO Pay report from 2015-2022
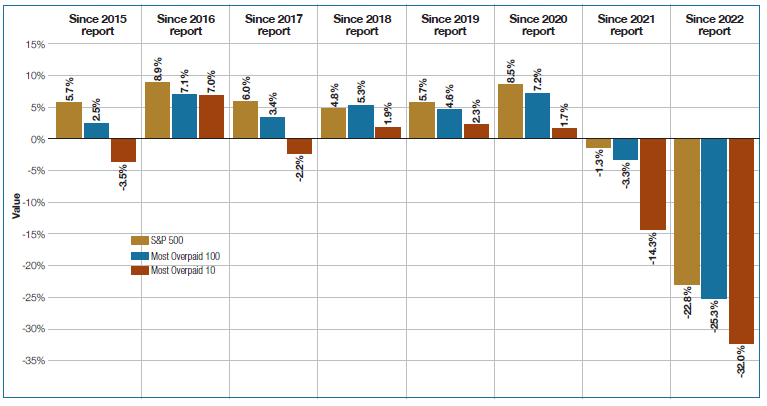
This concentration of underperformance is matched by a concentration in compensation. On average, 10 percent of compensation paid to all S&P 500 CEOs only goes to the ten most overpaid. That means 2 percent of CEOs get 10 percent of compensation.
Calculating these averages across all reports, leads to an astounding amount of money. The CEOs who did not make the list received an average compensation of under US$9.5 million. The ten most overpaid, however, received seven times that amount – on average more than US$60 million.
For comparison to front-line workers and citizens, this figure is 3,978 years of the latest U.S. minimum wage. A person working for nearly four millennia could have spent their first workday with one of the last wooly mammoths around 2000 B.C. and still be working today. A whole village of 95 minimum-wage workers would have to combine their entire life earnings to reach US$60 million.
At the same time, these two percent of CEOs managed to lead their companies to an average underperformance of over -6 percent annualized. The boards responsible for these pay packages have, over the years since 2015, wasted an extra US$4 billion on sub-par performance – overpaying for underperformance is not what boards are supposed to achieve, but rather a prudent investment of resources and mitigation of long-term risks.
While these numbers are staggering, this year’s ten Most Overpaid CEOs – 10 white men with an average age of 60 – doubled their average compensation to US$120 million. The boards of this year’s ten most overpaid decided that a total investment of US$1.2 billion on ten people was the best way their companies could use their resources. Warner Bros. Discovery and its predecessor Discovery have been in the top 20 every year. This year, its board decided to pay its CEO David M. Zaslav a total of US$246 million (16,000 years, or 388 life earnings).
Your portfolio is your money. The companies and funds you invest in should be aligned with your values and way of seeing the world. The most overpaid CEO pay packages are approved by boards, elected by you – the investor – and the asset managers who hold their stocks in mutual funds and ETFs. We encourage you as investors to speak up, vote your “say on pay,” and compel the companies and funds in your portfolio with this evidence – which can benefit your long-term financial performance and a more appropriate level of rewards for results achieved.
ENDNOTES
1. Sarah Anderson, Sam Pizzigati, and Brian Wakamo, Executive Excess 2022, Institute for Policy Studies, June 2022, https://ips-dc.org/report-executive-excess-2022/.
2. Lucian Bebchuk and Jesse Fried, “Pay without Performance: The unfulfilled Promise of Executive Compensation,” Harvard University Press, 2006; Steven Clifford, “The CEO Pay Machine: How it Trashes America and How to Stop it,” Random House Publishing, 2017.
3. Josh Bivens and Jori Kandra, “CEO Pay Has Skyrocketed 1,460% Since 1978: CEOS Were Paid 399 Times as Much as a Typical Worker in 2021,” Economic Policy Institute, October 10, 2022, https://www.epi.org/publication/ceo-pay-in-2021/.
4. Josh Bivens and Jori Kandra, “CEO Pay Has Skyrocketed 1,460% Since 1978: CEOS Were Paid 399 Times as Much as a Typical Worker in 2021,” Economic Policy Institute, October 10, 2022, https://www.epi.org/publication/ceo-pay-in-2021/.
5. Insightia and WTW, Executive Compensation 2022, ed. Josh Black, December 1, 2022, https://www.insightia.com/press/reports/.
6. AFL-CIO, “PayWatch,” 2022, https://aflcio.org/paywatch.
7. Aman Malhotra and David Sims, “Equipped for Uncertainty: Executive Pay Programs and Governance for the Future” (WTW Webcast presentation, New York, NY, June 9, 2022) https://custom.cvent.com/961E1240D361459B8DECCABD6463C35A/files/de04f260a64049bc8d6022088a3bd6c9.pdf.
8. Aman Malhotra and David Sims, “Equipped for Uncertainty: Executive Pay Programs and Governance for the Future” (WTW Webcast presentation, New York, NY, June 9, 2022) https://custom.cvent.com/961E1240D361459B8DECCABD6463C35A/files/de04f260a64049bc8d6022088a3bd6c9.pdf.
9. Inti Pacheco and Theo Francis, “The Highest Paid CEOs in the S&P 500: Top Pay Packages of 2021,” The Wall Street Journal, May 15, 2022, https://www.wsj.com/articles/highest-paid-ceos-top-salaries-2021-ranking-11652537876?mod=series_ceopay#.
10. Tornetta v. Musk Et Al Tesla shareholders’ CEO compensation plan lawsuit, filed w Court of Chancery, State of Delaware, November 1, 2022. https://www.scribd.com/document/604477337/Tornetta-v-Musk-et-al-Tesla-shareholders-CEO-compensation-plan-lawsuit.
11. HSBC, Stewardship and Engagement, 2022, HSBC, https://www.assetmanagement.hsbc.com/about-us/responsible-investing/stewardship.
12. Website University of California, Proxy Voting Dashboard https://vds.issgovernance.com/vds/#/MzY1OQ==/.
13. Notice of Exempt Solicitation, Submitted by The Comptroller of the City of New York, on behalf of the New York City Employees’ Retirement System, Teachers’ Retirement System of The City of New York, New York City Police Pension Fund, and the New York City Fire Pension Fund, April 21, 2022. https://www.sec.gov/Archives/edgar/data/1018724/000121465922005572/e420220px14a6g.htm.
LEGAL DISCLAIMER
The information provided in this report is provided “AS IS” without warranty of any kind. As You Sow makes no representations and provides no warranties regarding any information or opinions provided herein, including, but not limited to, the advisability of investing in any particular company or investment fund or other vehicle. While we have obtained information believed to be objectively reliable, neither As You Sow nor any of its employees, officers, directors, trustees, or agents, shall be responsible or liable, directly or indirectly, for any damage or loss caused or alleged to be caused by or in connection with use of or reliance on any information contained herein, including, but not limited to, lost profits or punitive or consequential damages. Past performance is not indicative of future returns.
As You Sow does not provide investment, financial planning, legal, or tax advice. We are neither licensed nor qualified to provide any such advice. The content of our programming, publications, and presentations is provided free of charge to the public for informational and educational purposes only, and is neither appropriate nor intended to be used for the purposes of making any decisions on investing, purchases, sales, trades, or any other investment transactions.
Our events, websites, and promotional materials may contain external links to other resources, and may contain comments or statements by individuals who do not represent As You Sow. As You Sow has no control over, and assumes no responsibility for, the content, privacy policies, or practices of any third party websites or services that you may access as a result of our programming. As You Sow shall not be responsible or liable, directly or indirectly, for any damage or loss caused or alleged to be caused by or in connection with use of or reliance on any such content, goods, or services available on or through any such websites or services.
Authors
Rosanna Landis Weaver is the Director, Wage Justice and Executive Compensation at As You Sow®.
This is the ninth annual report of “The 100 Most Overpaid CEOs of the S&P 500: Are Fund Managers Asleep at the Wheel?” that Weaver has written for As You Sow. Weaver began her corporate governance career with a position in the corporate affairs office at the International Brotherhood of Teamsters in 1992, supervising research on corporate governance. She has worked for the Investor Responsibility Research Center (IRRC). At Institutional Shareholder Services (ISS), which she joined in 2005, she was a senior analyst on the executive compensation team, with a particular focus on change of control agreements, and analyzed Say on Pay resolutions. Weaver holds a bachelor’s degree in English from Goshen College and a master’s in American Studies from the University of Notre Dame.
Melissa Walton is the Executive Compensation Senior Associate at As You Sow. Melissa is the lead author of As You Sow’s 2022 report, “Pay for Climate Performance: Linking CEO Compensation to Emissions Reduction.” She holds a bachelor’s degree from Emory University, a master’s in environmental management from Duke University, and an MBA in Sustainable Solutions from Presidio Graduate School.
Throughout the spring, as proxies are filed, this team provides updates and compensation analysis on its blog, which can be found at https://www.asyousow.org/our-work/ceo-pay/blog/. You can sign up for emails that summarize these blog posts during proxy season at https://go.asyousow.org/ceo-pay-alerts.
Acknowledgements
This report was made possible by the generous support of the Stephen M. Silberstein Foundation. Additional support was provided by the Argosy Foundation, Arntz Family Foundation, Firedoll Foundation, Fred Gellert Family Foundation, Hanley Foundation, Laird Norton Family Foundation, Manaaki Foundation, Roddenberry Family Foundation, and Singing Field Foundation.
Special thanks to:
• ESGAUGE is a data mining and analytics firm providing customized information on U.S. public companies. ESGAUGE provided 2021 compensation data for the S&P 500 for our analysis. Their work was quick, accurate, and very helpful.
• The database of Insightia, a Diligent Brand, provided valuable information. Oliver Taylor was extremely helpful with reams of data and remained patient while answering numerous specific questions.
• The Human Impact + Profit (HIP) Investor team conducted the regression analysis, upon which a key component of this report rests. HIP Investor (www.HIPInvestor.com), founded in 2006, rates 140,000 investments (stocks, bonds, funds) on aspects of sustainability (including corporate CEO pay) and how it can correlate to future risk and return potential. Onindo Khan and R. Paul Herman (HIP’s CEO) once again provided this original research for us.
Robert Reich’s support for this project and the fight to address income inequality has always been an inspiration. His insights during our webinars add expert high-level wisdom and expand our reach beyond the shareholder advocacy community. We are very grateful to him and his staff at Inequality Media, including Heather Kinlaw Lofthouse.
The As You Sow team (alphabetically by last name): Andrew Behar, Hillary Bowling, Jill Courtenay, Ryon Harms, Wesley, Henjum, Susan Honea, Brenna McMillen, Sarah Milne, Forest Resener, Stephanie Sandmeyer and Stefanie Spear. Thank you to Rachel Sanderson for her writing and editing assistance. Special thanks to John Opet of Art270.