Workplace Equity Report
PROMOTING DIVERSITY, EQUITY, AND INCLUSION THROUGH EDUCATIONAL SCORECARDS
As You Sow’s shareholder engagements related to the effective management of staff as a resource are informed by the data within the Workplace Equity Disclosure Scorecard. Companies are asked to release promotion, hiring/recruitment, and retention/turnover rates for employees, as well as two, or more, years of EEO-1 forms.
The release of the data is important from a transparency perspective and signals a company’s dedication to being able to source top talent, regardless of political headwinds. From a communications perspective we also recommend that companies place the data within a tailored narrative context specific to their organization, as to add additional details behind the numbers. The workplace equity data visualization tool tracks both released data and data that companies have committed to release.
CLICK IMAGE TO VIEW Scorecard / Data Visualization
Data related to workforce demographics helps investors, employees, and other external stakeholders understand if significant variances exist between a workforce composition that would reflect a meritocratic workplace versus one that may contain bias and discrimination which would diminish the effectiveness of the workforce.
BENCHMARKING METHODOLOGY, SCORING, AND KEY PERFORMANCE INDICATORS

As You Sow, in collaboration with the consultancy Whistle Stop Capital, has examined the websites and sustainability reports for each company in the Large-Cap 3000 to determine their current levels of transparency. Corporate disclosures of the aforementioned data contributed to companies’ scores, all of which were identified on a binary yes/no. That is, if a company releases the data set identified within the last five years, it receives all of the possible points for that set. The weighting of each data set is a reflection of how important the information is from a transparency perspective, relative to an investors’ ability to understand the effectiveness of a corporate employee inclusion program.
Our researchers visit corporate websites, looking through company reporting, blogs, sustainability/corporate responsibility/ annual reports, public SEC filings, and career pages as well as the companies’ social media sites. It is possible that they missed some reporting, or that the company has shifted its reporting since our review. To inform us of corporate reporting not captured here, please send a note to [email protected].
Our findings are presented on As You Sow’s website using a data visualization tool that enables dynamic analysis and sorting. The data is updated each quarter, with a major update annually.
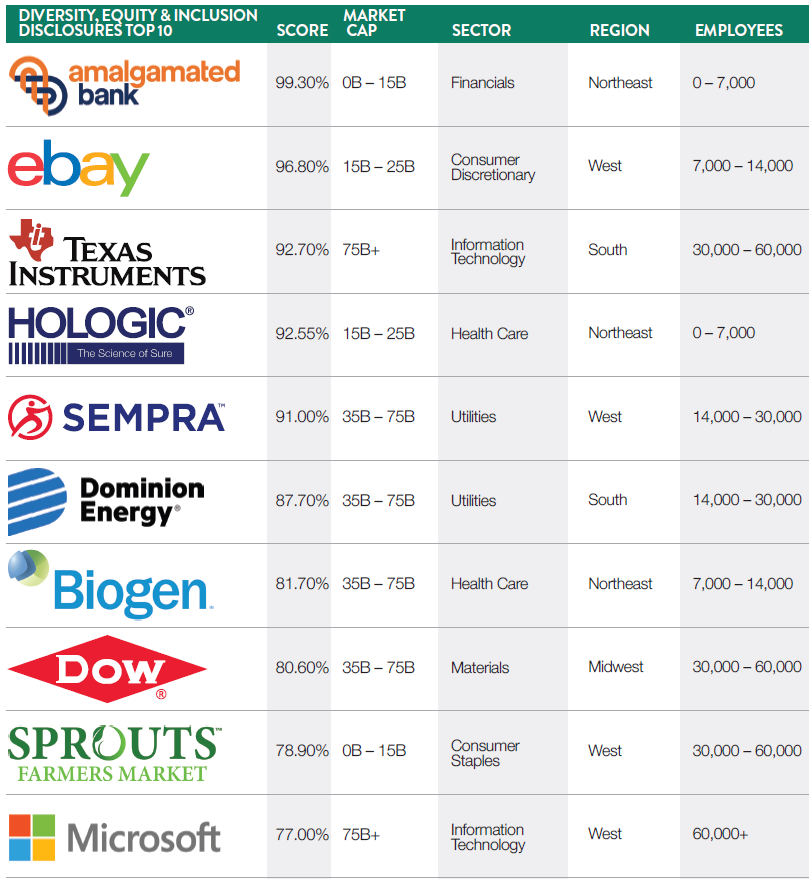
LEADERS: TOP 10
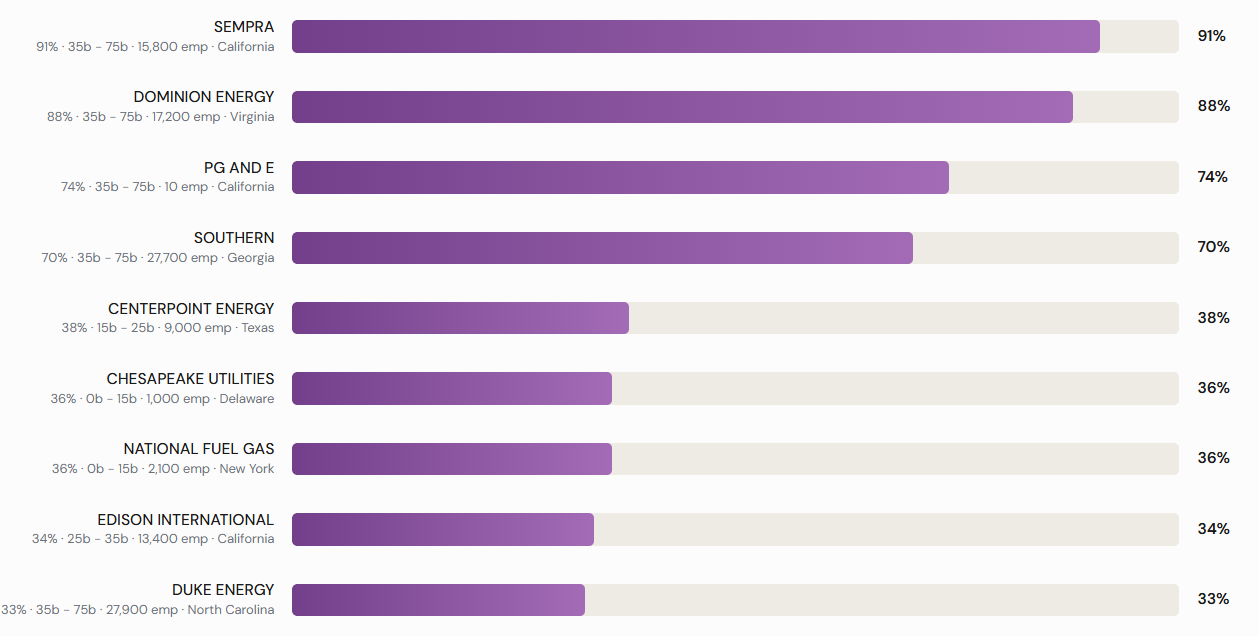
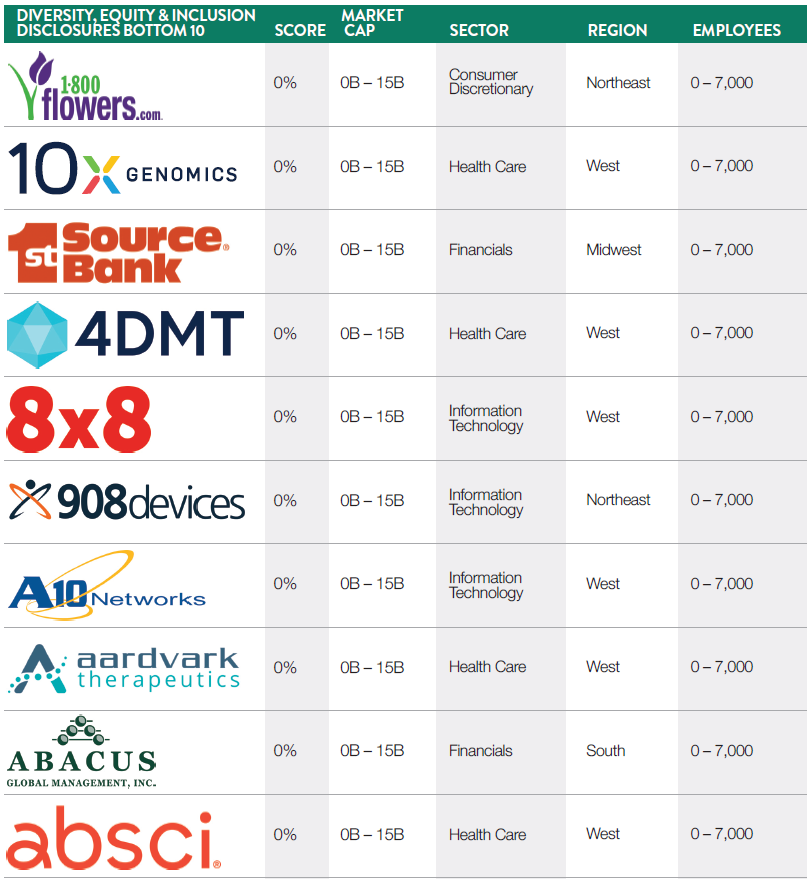
LAGGARDS: BOTTOM 10
QUARTERLY KEY FINDINGS
Disclosure of workforce demographic data is now standard practice among large-cap companies, with 86% of S&P500 companies and 74% of Russell 1000 companies reporting some level of workforce composition data by gender and/or race.
From 2025 to 2026, the number of companies in the Russell 1000 group disclosing any workforce demographic data declined from 877 to 734, representing an approximate 16.3% decrease. During this time period (and within the same index), the number of companies disclosing EEO-1 data declined from 450 to 358, representing an approximate 20.4% decrease.
From 2025 to 2026, the number of companies in the Russell 1000 group disclosing promotion rate data by gender declined from 88 to 73, indicating an approximate 16.6% decrease. During this time period (and within the same index), the number of companies disclosing promotion rate data by race declined from 43 to 25, indicating an approximate 41.5% decrease.
From 2025 to 2026, the number of companies in the Russell 1000 group disclosing retention rate by gender decreased from 169 to 166 and the number of companies reporting retention rate data by race decreased from 54 to 50, representing an approximate 2.1% and 7.1% decrease respectively.
From 2025 to 2026, the number of companies in the Russell 1000 group disclosing hiring rate data by gender decreased from 267 to 215, signifying an approximate 19.5% decrease.
Implication of Findings:
The data suggests a shift in corporate disclosure behavior, reflecting an operating environment characterized by heightened legal, regulatory, and reputational sensitivity around certain DEI metrics. These findings are consistent with reporting from the Conference Board, which indicates that several large U.S. public companies are reframing how they communicate diversity initiatives.
The decrease in overall workforce and EEO-1 disclosure indicates a pullback in comprehensive transparency in diversity and inclusion metrics. At the same time, the decline in promotion rate, disclosure, especially by race, retention rate disclosure, and hiring rate disclosure, especially by gender, point to reduced willingness to disclose more sensitive or potentially scrutinized metrics related to internal equity and advancement.
KEY PERFORMANCE INDICATORS AND SCORING RUBRIC
| PILLAR | # | KEY PERFORMANCE INDICATOR | SCORING RUBRIC | WEIGHTING |
|---|---|---|---|---|
| Workforce Composition | 1 | Release of workforce composition | 0 or 1 | 5.70% |
| Workforce Composition | 2 | Release of EEO-1 form | 0 or 1 | 20.00% |
| Pay Equity Data Reporting | 3 | Mean pay gap data by gender | 0 or 1 | 1.25% |
| Pay Equity Data Reporting | 4 | Mean pay gap data by race/ethnicity | 0 or 1 | 1.25% |
| Pay Equity Data Reporting | 5 | Median pay gap data by gender | 0 or 1 | 1.25% |
| Pay Equity Data Reporting | 6 | Median pay gap data by race/ethnicity | 0 or 1 | 1.25% |
| Promotion | 7 | Male | 0 or 1 | 2.20% |
| Promotion | 8 | Female | 0 or 1 | 2.20% |
| Promotion | 9 | White | 0 or 1 | 2.20% |
| Promotion | 10 | Black | 0 or 1 | 2.20% |
| Promotion | 11 | Hispanic | 0 or 1 | 2.20% |
| Promotion | 12 | Asian | 0 or 1 | 2.20% |
| Promotion | 13 | Native American | 0 or 1 | 2.20% |
| Promotion | 14 | Pacific Islander | 0 or 1 | 2.20% |
| Promotion | 15 | Two or more races | 0 or 1 | 2.20% |
| Hiring | 16 | Male | 0 or 1 | 2.20% |
| Hiring | 17 | Female | 0 or 1 | 2.20% |
| Hiring | 18 | White | 0 or 1 | 2.20% |
| Hiring | 19 | Black | 0 or 1 | 2.20% |
| Hiring | 20 | Hispanic | 0 or 1 | 2.20% |
| Hiring | 21 | Asian | 0 or 1 | 2.20% |
| Hiring | 22 | Native American | 0 or 1 | 2.20% |
| Hiring | 23 | Pacific Islander | 0 or 1 | 2.20% |
| Hiring | 24 | Two or more races | 0 or 1 | 2.20% |
| Retention or Turnover | 25 | Male | 0 or 1 | 3.30% |
| Retention or Turnover | 26 | Female | 0 or 1 | 3.30% |
| Retention or Turnover | 27 | White | 0 or 1 | 3.30% |
| Retention or Turnover | 28 | Black | 0 or 1 | 3.30% |
| Retention or Turnover | 29 | Hispanic | 0 or 1 | 3.30% |
| Retention or Turnover | 30 | Asian | 0 or 1 | 3.30% |
| Retention or Turnover | 31 | Native American | 0 or 1 | 3.30% |
| Retention or Turnover | 32 | Pacific Islander | 0 or 1 | 3.30% |
| Retention or Turnover | 33 | Two or more races | 0 or 1 | 3.30% |